The State of Business Spend: Q1 2023

Ameyna Jackson


In today’s ever-changing macroeconomic environment, how businesses choose to allocate company funds is more critical than ever. Concerns continue to swirl about reductions in headcount, shrinking budgets, travel cuts, and the elimination of single-use or overlapping software — despite the fact that the economy is not in a recession.
But are all businesses and segments reacting the same way? Navan analyzed key areas of business spend to identify trends and patterns that present a clearer picture of the business finance world.
This report — part of a series that also analyzes Navan data around business travel and personal travel — covers trends in spending across different industries and company sizes. It identifies areas that have seen significant increases or decreases in spending and highlights key spending patterns.
Let’s go.
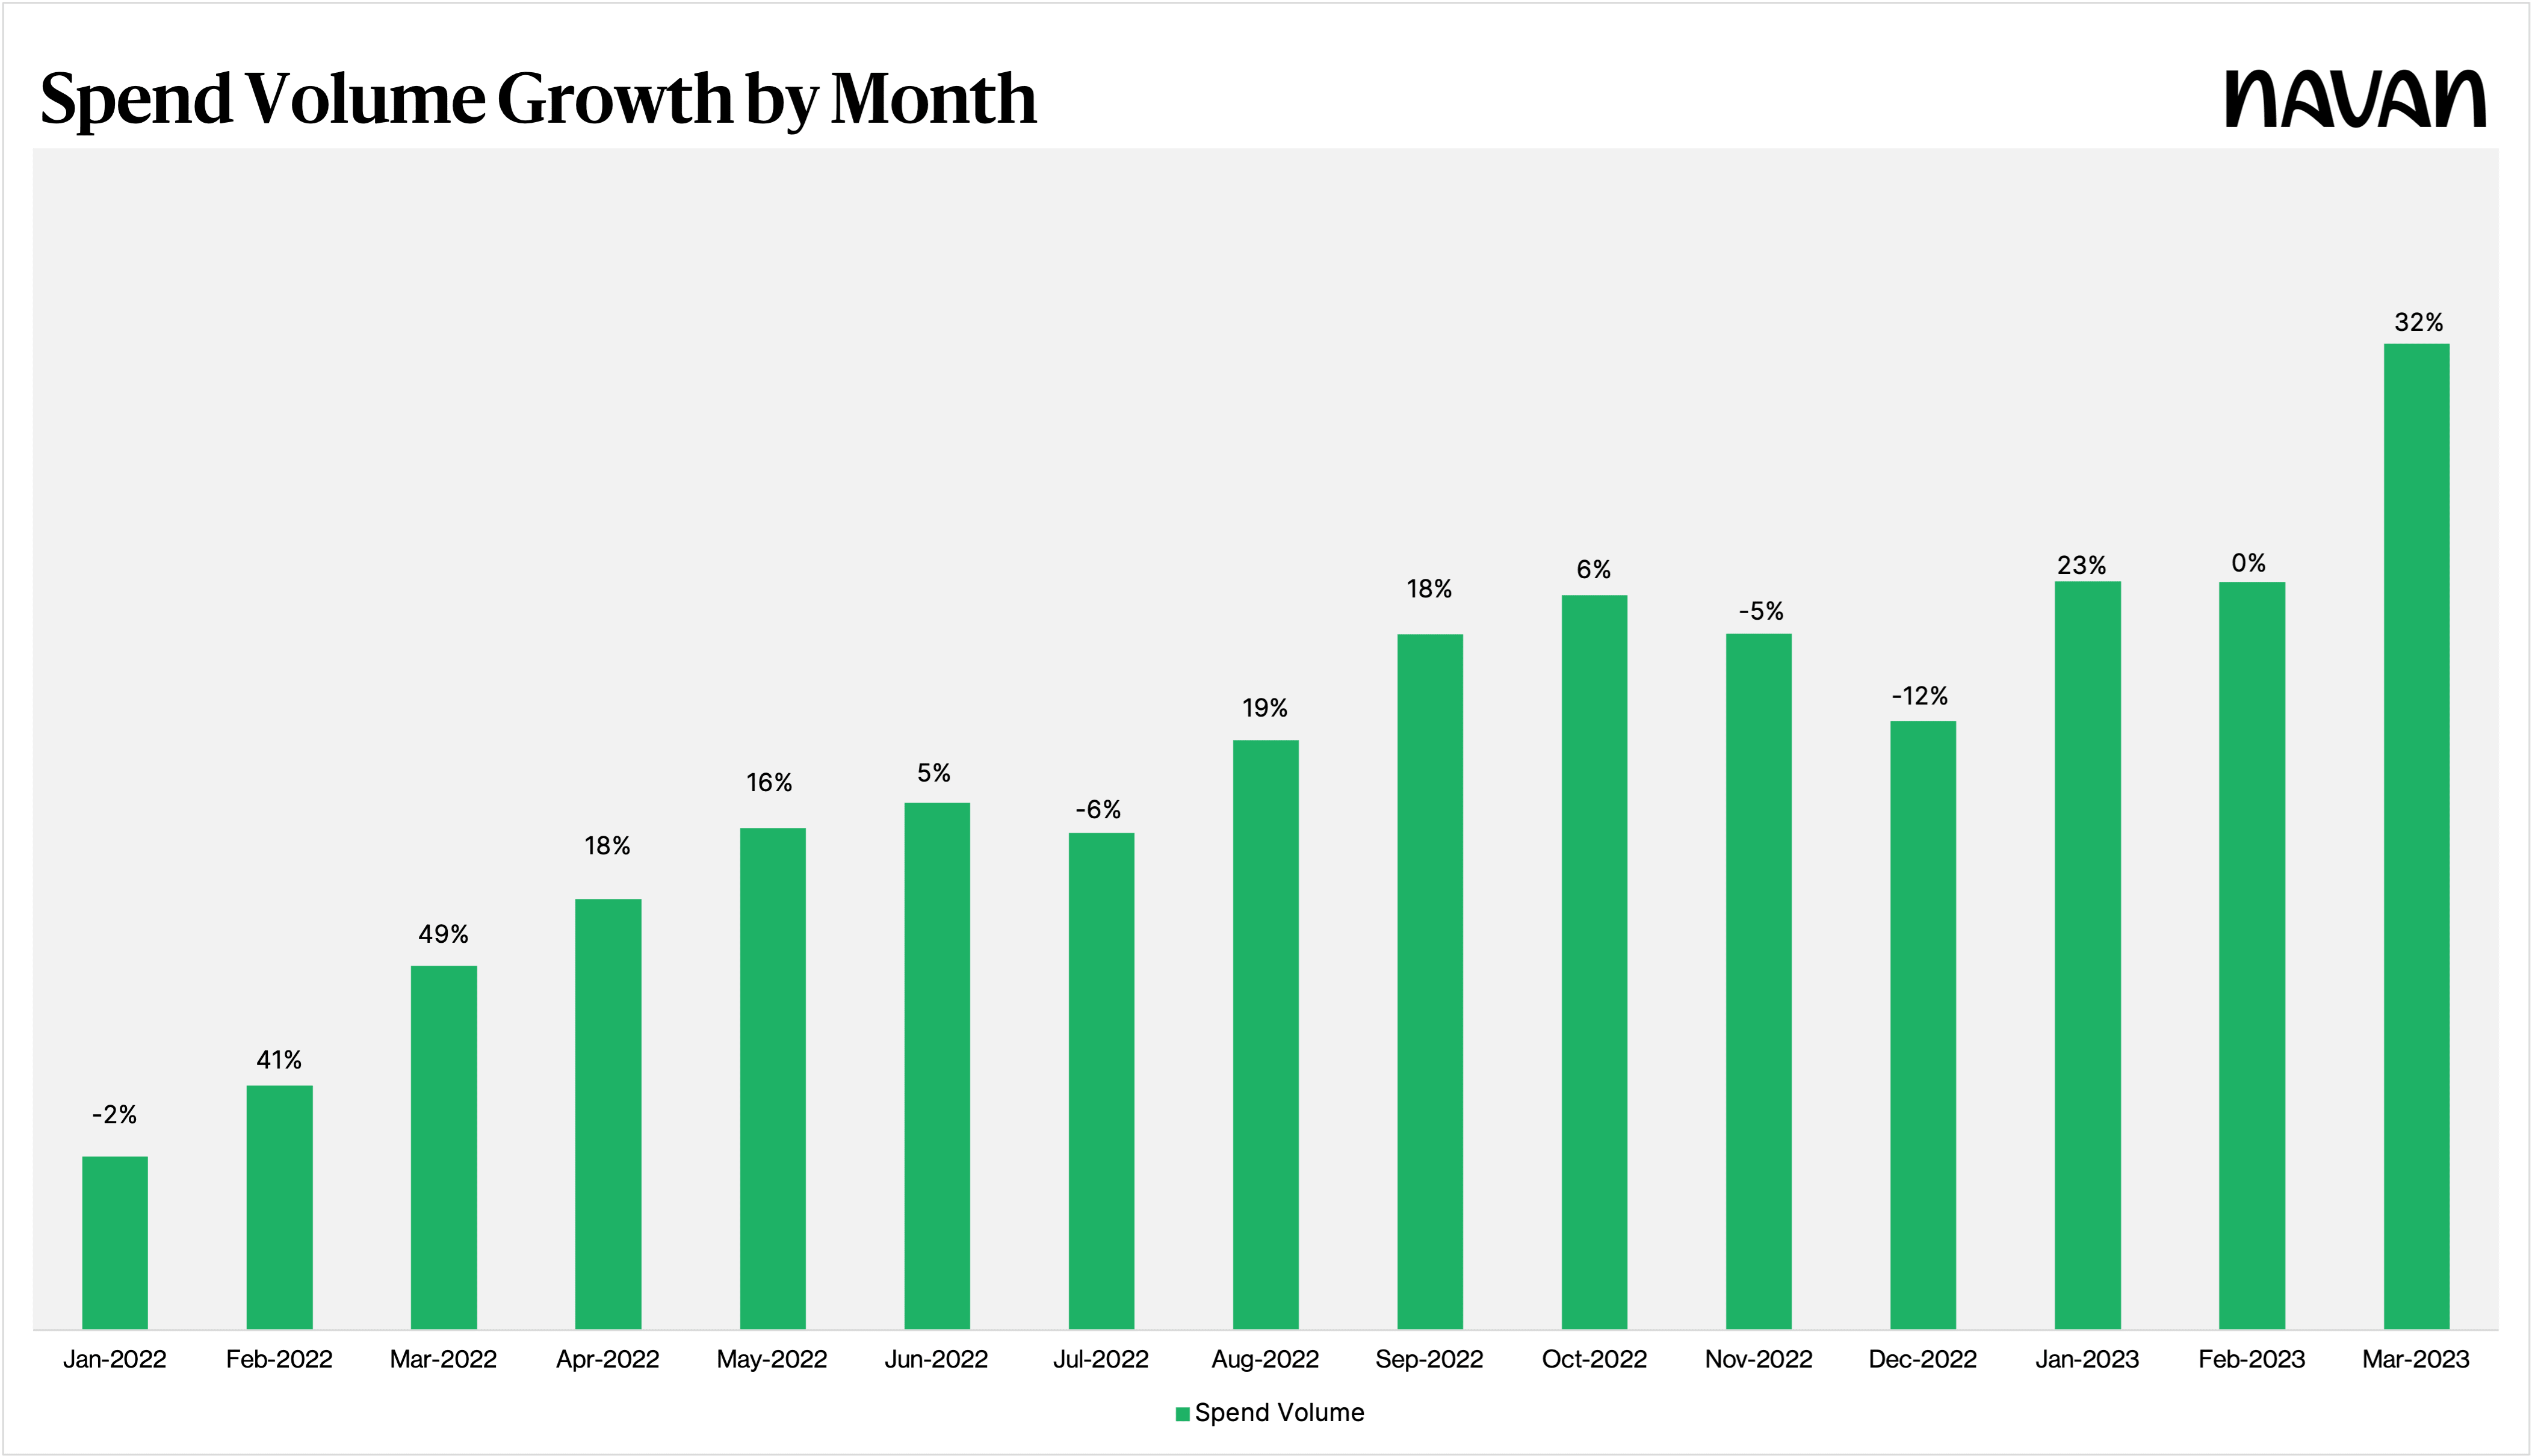
Spend Volume
Spend volume processed via Navan Expense in Q1 2023 grew more than 3x compared to Q1 2022 — and more than 5x when looking at the 12 consecutive months ending in March 2023, as compared to the preceding 12 months. Following a flat February, spend jumped 32% in March to close the quarter strong.
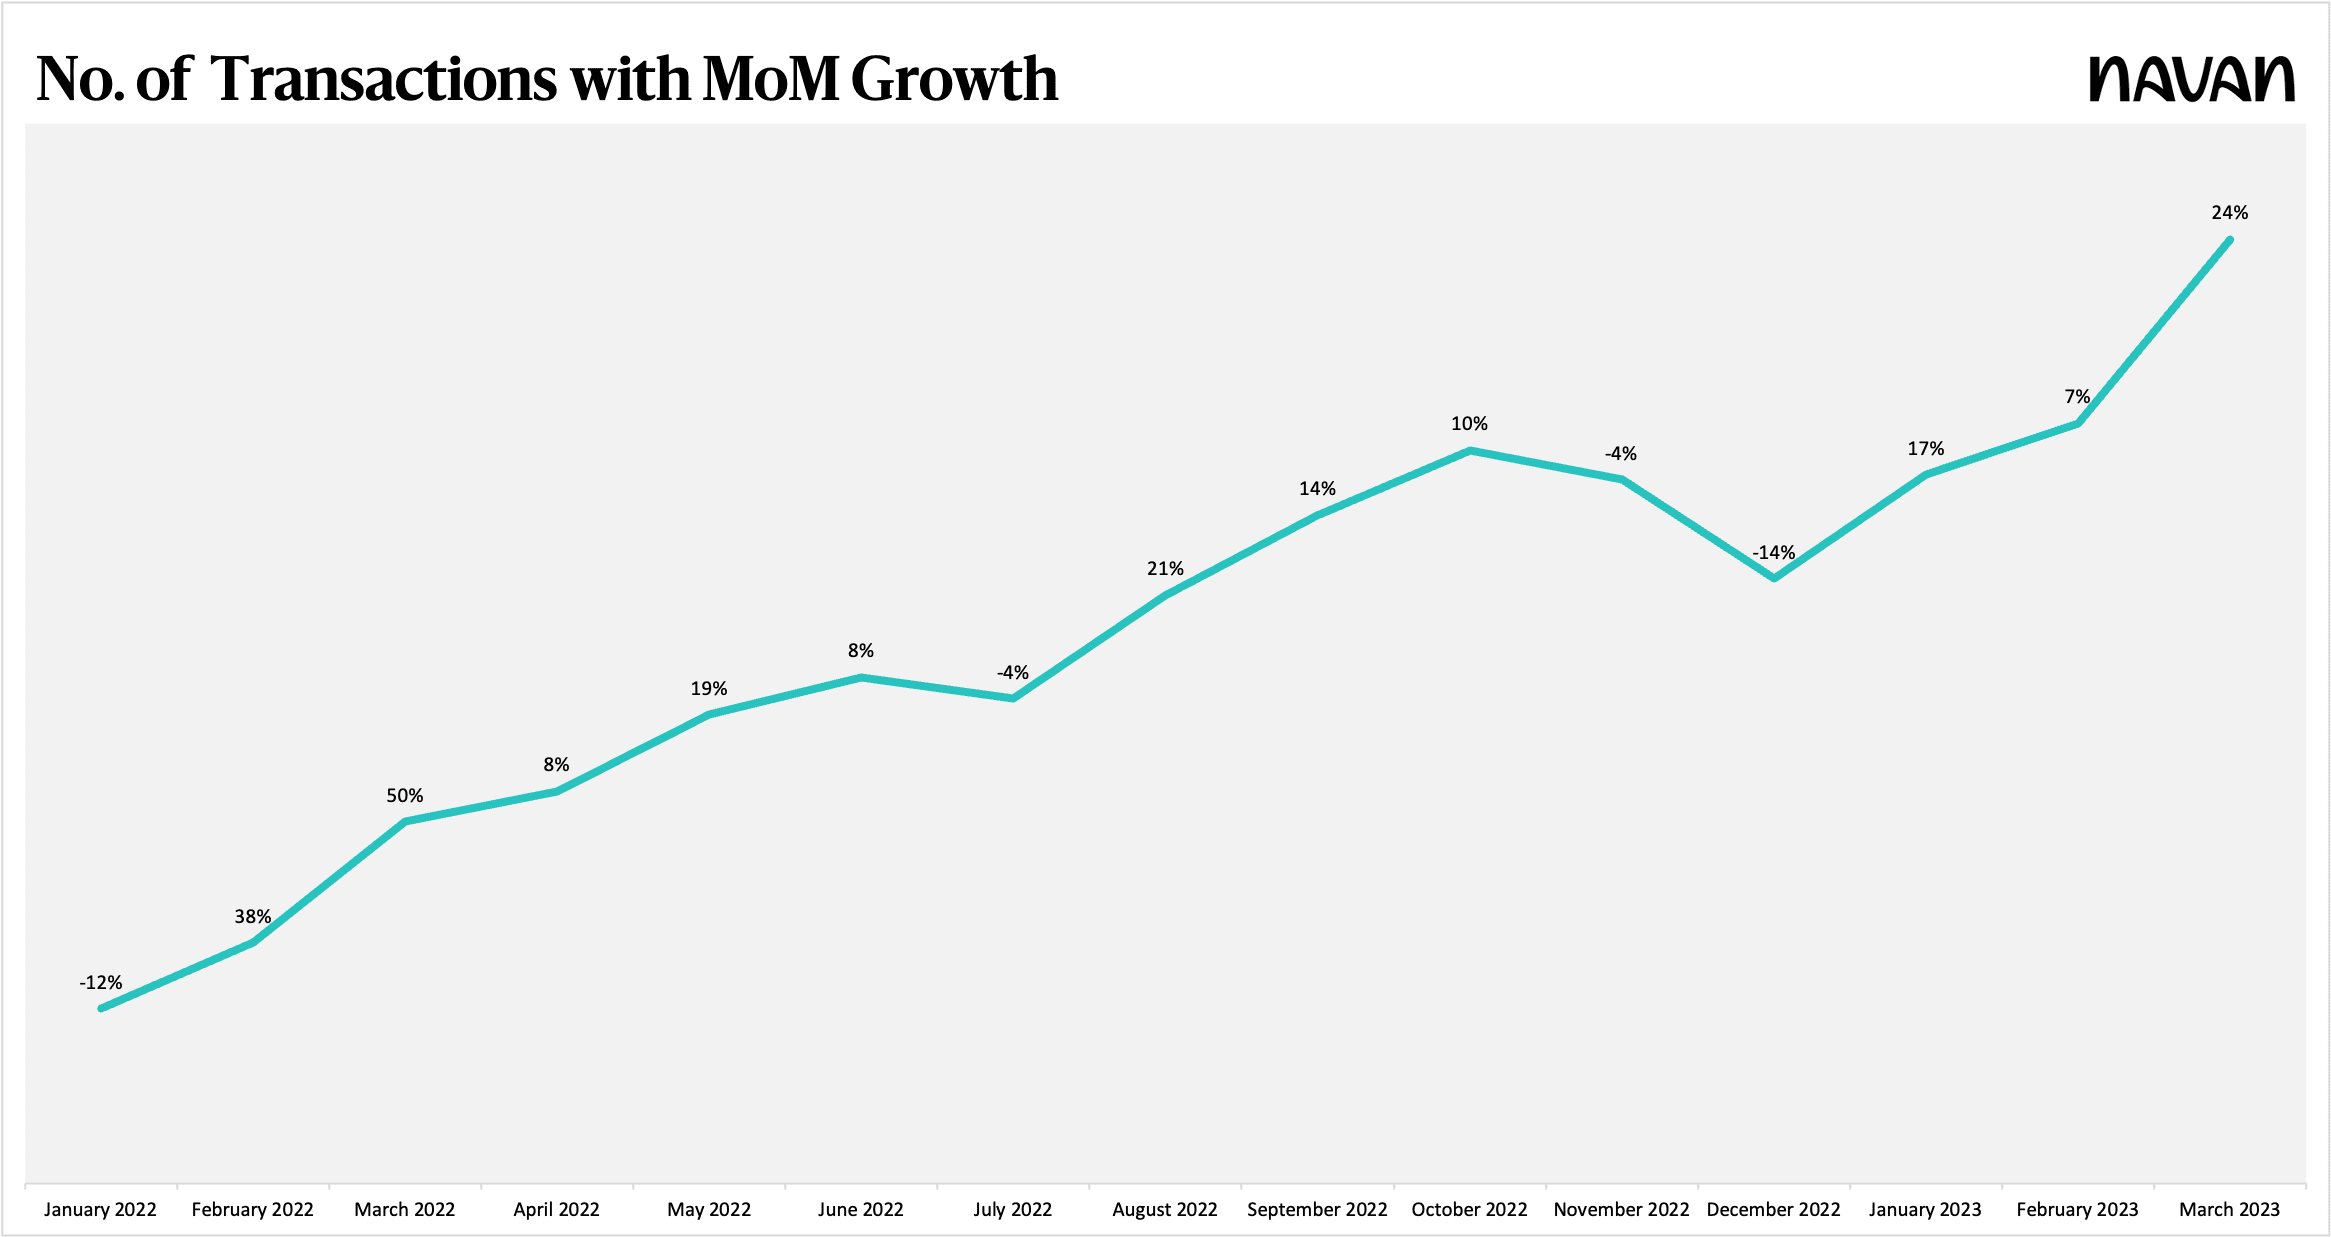
Number of Transactions
The number of transactions (i.e.: the number of times purchases were made) processed by Navan Expense increased 3x from Q1 2022 to Q1 2023, with a 24% increase from February 2023 to March 2023 alone.
Spend Share Shifts
As a full end-to-end expense management solution, Navan Expense processes both travel and non-travel spend. Generally, we think of employee spending in two buckets — on-trip/travel-related (i.e., airfare, lodging, rideshares, food) and non-travel (recurring purchases like subscriptions, shipping, and one-off purchases). And, obviously, spending behavior changes depending on whether an employee is traveling or not.
Here’s the breakdown for travel and non-travel spend.
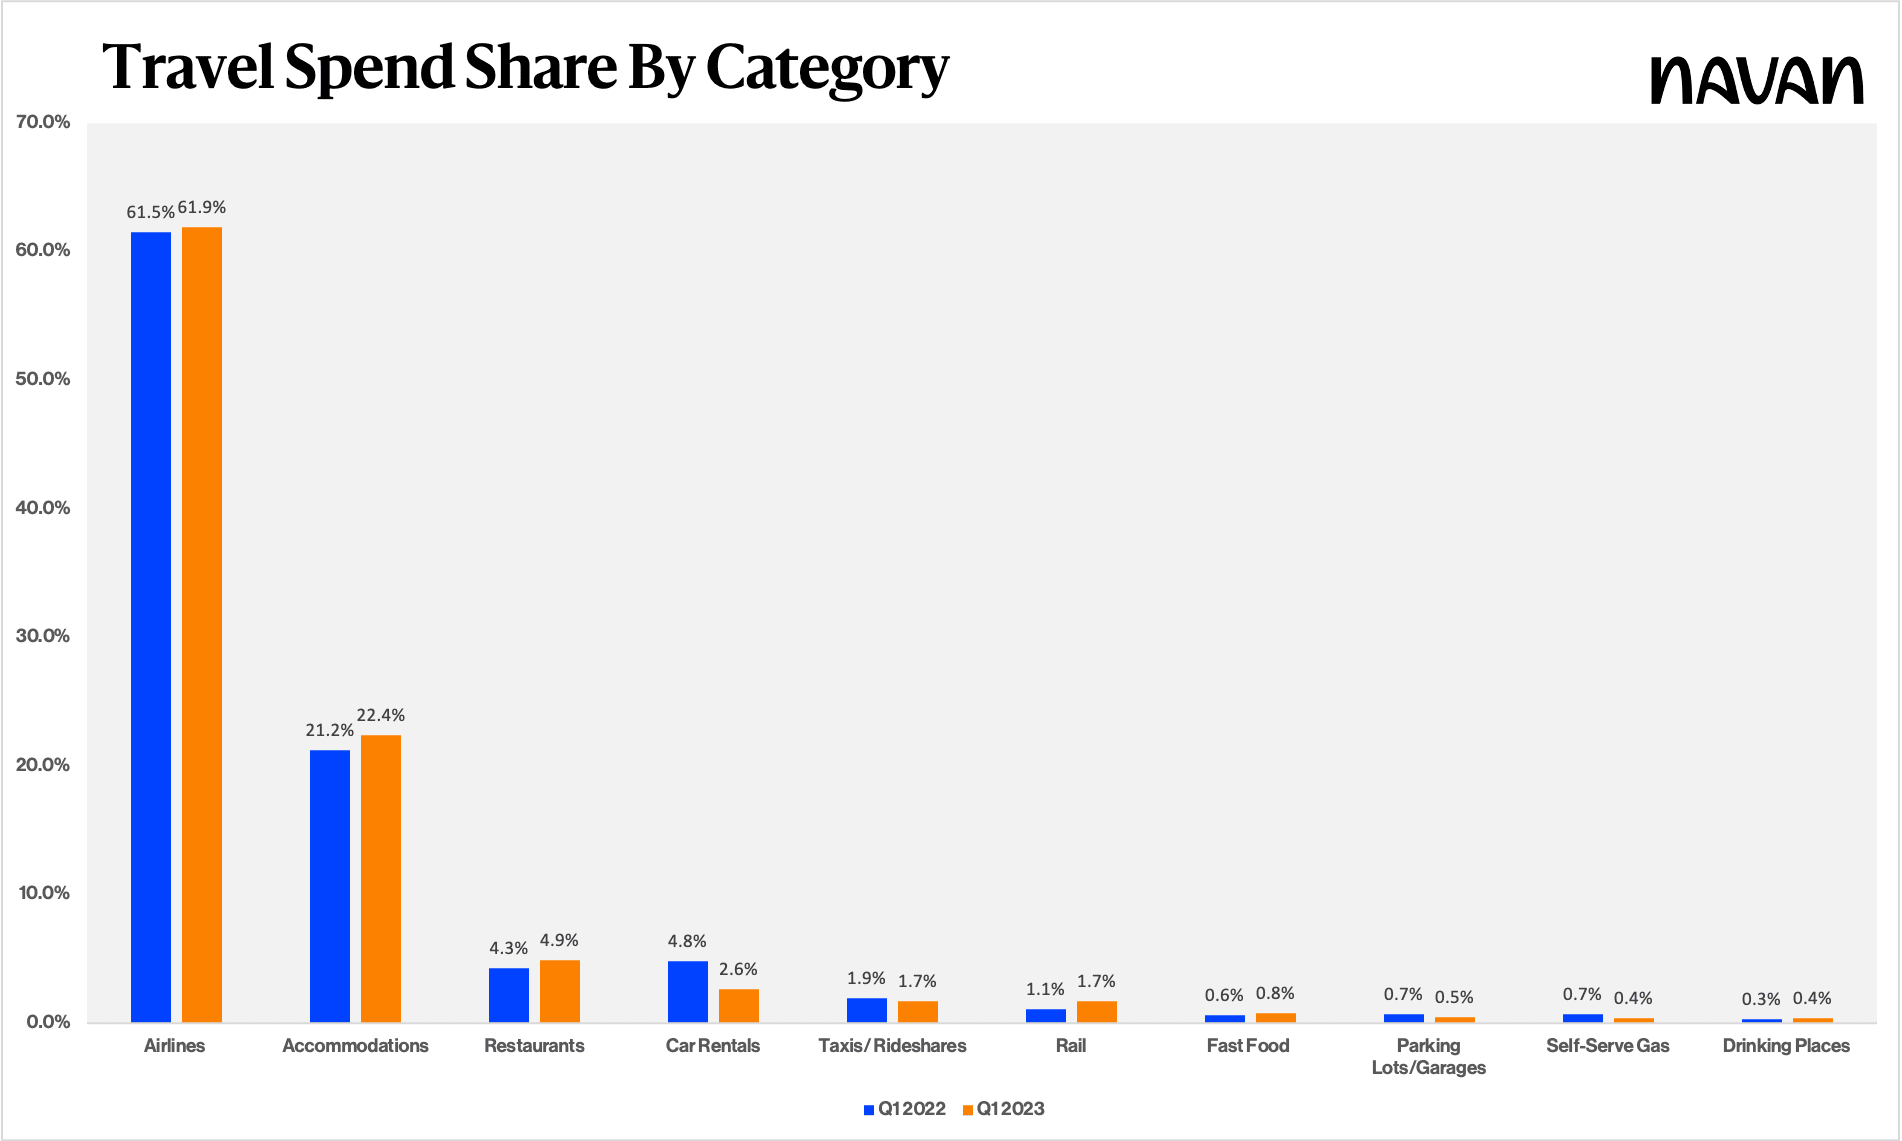
Travel Spend
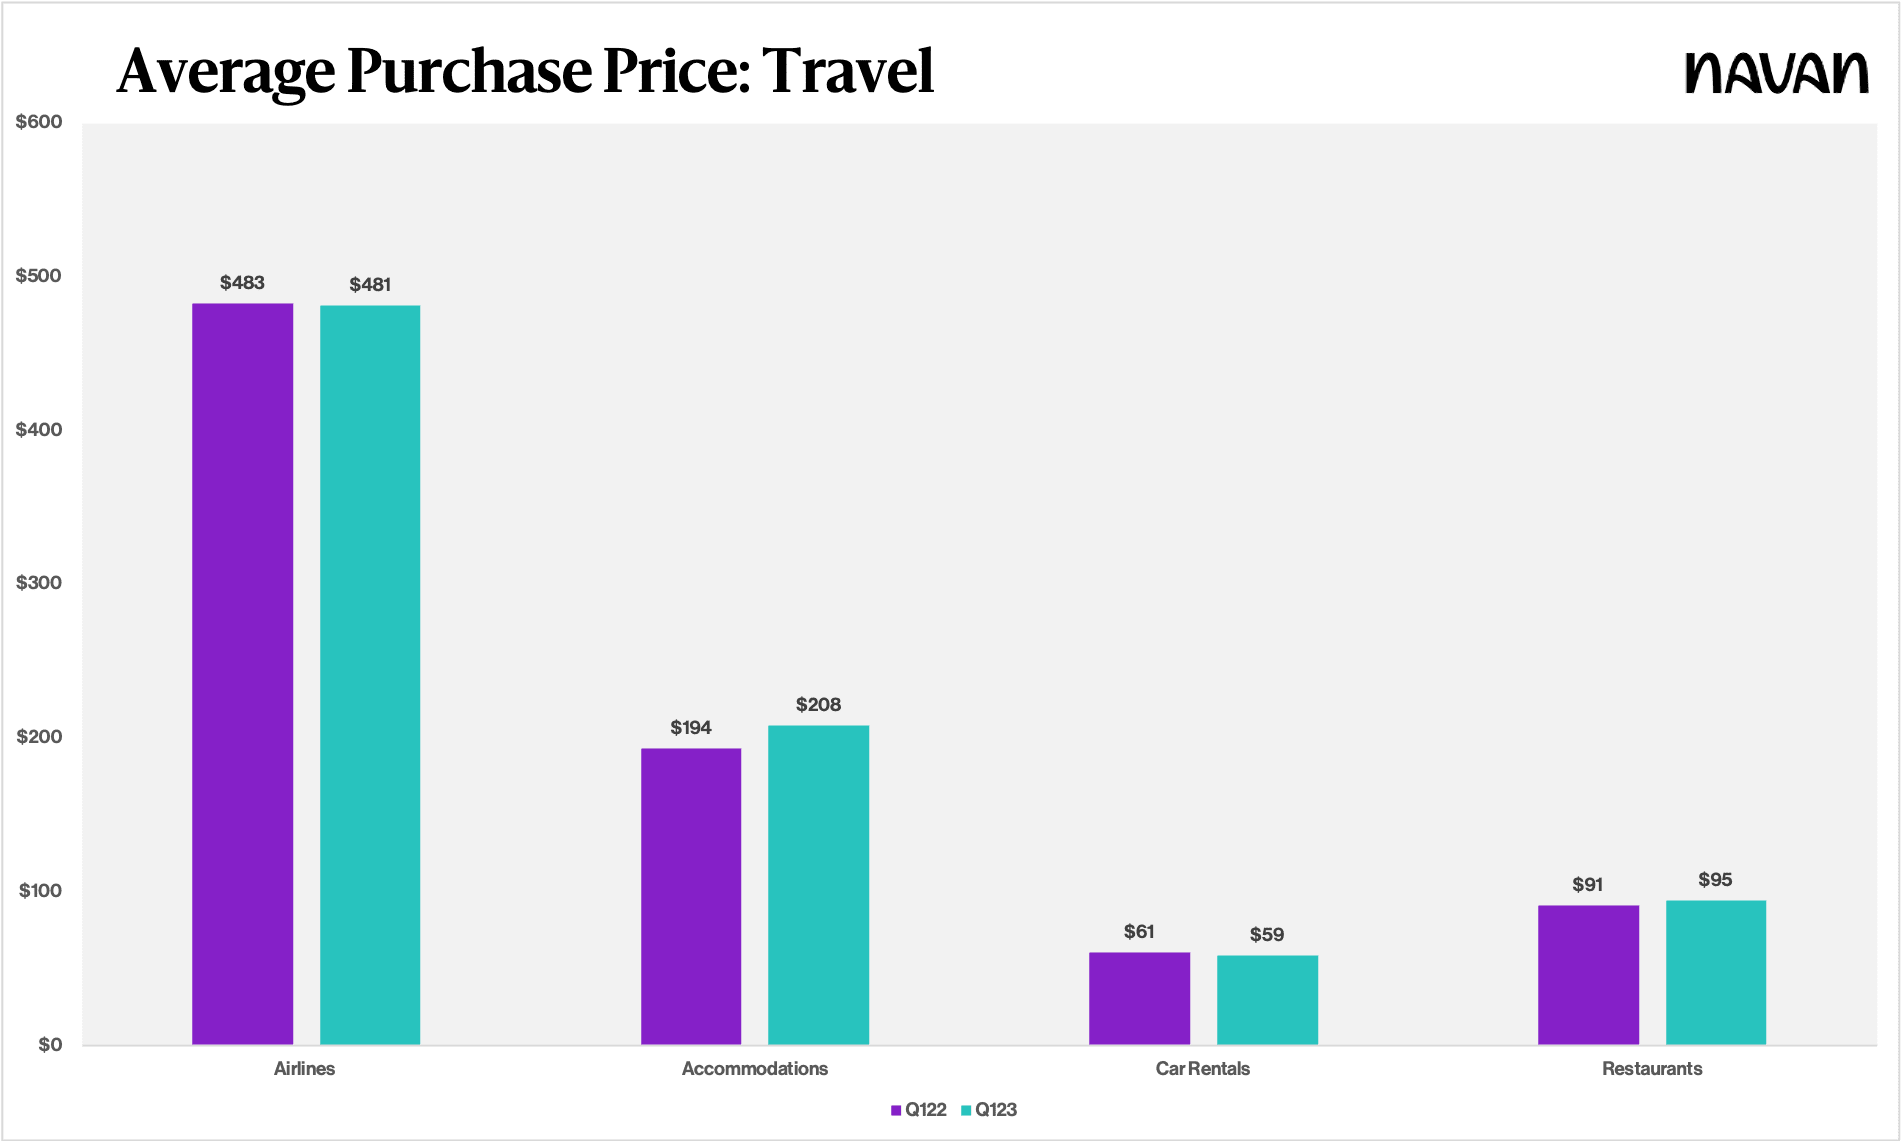
Airlines and accommodations remain the primary categories for business travel expenses across all business segments — with little change in spending patterns in these categories when compared to Q1 2022.
However, a notable trend in Q1 2023 is the decrease in expenditure on car rentals compared to the same period in the previous year. This decline may indicate a shift in business practices, with companies encouraging their employees to explore more cost-effective transportation options during their trips.
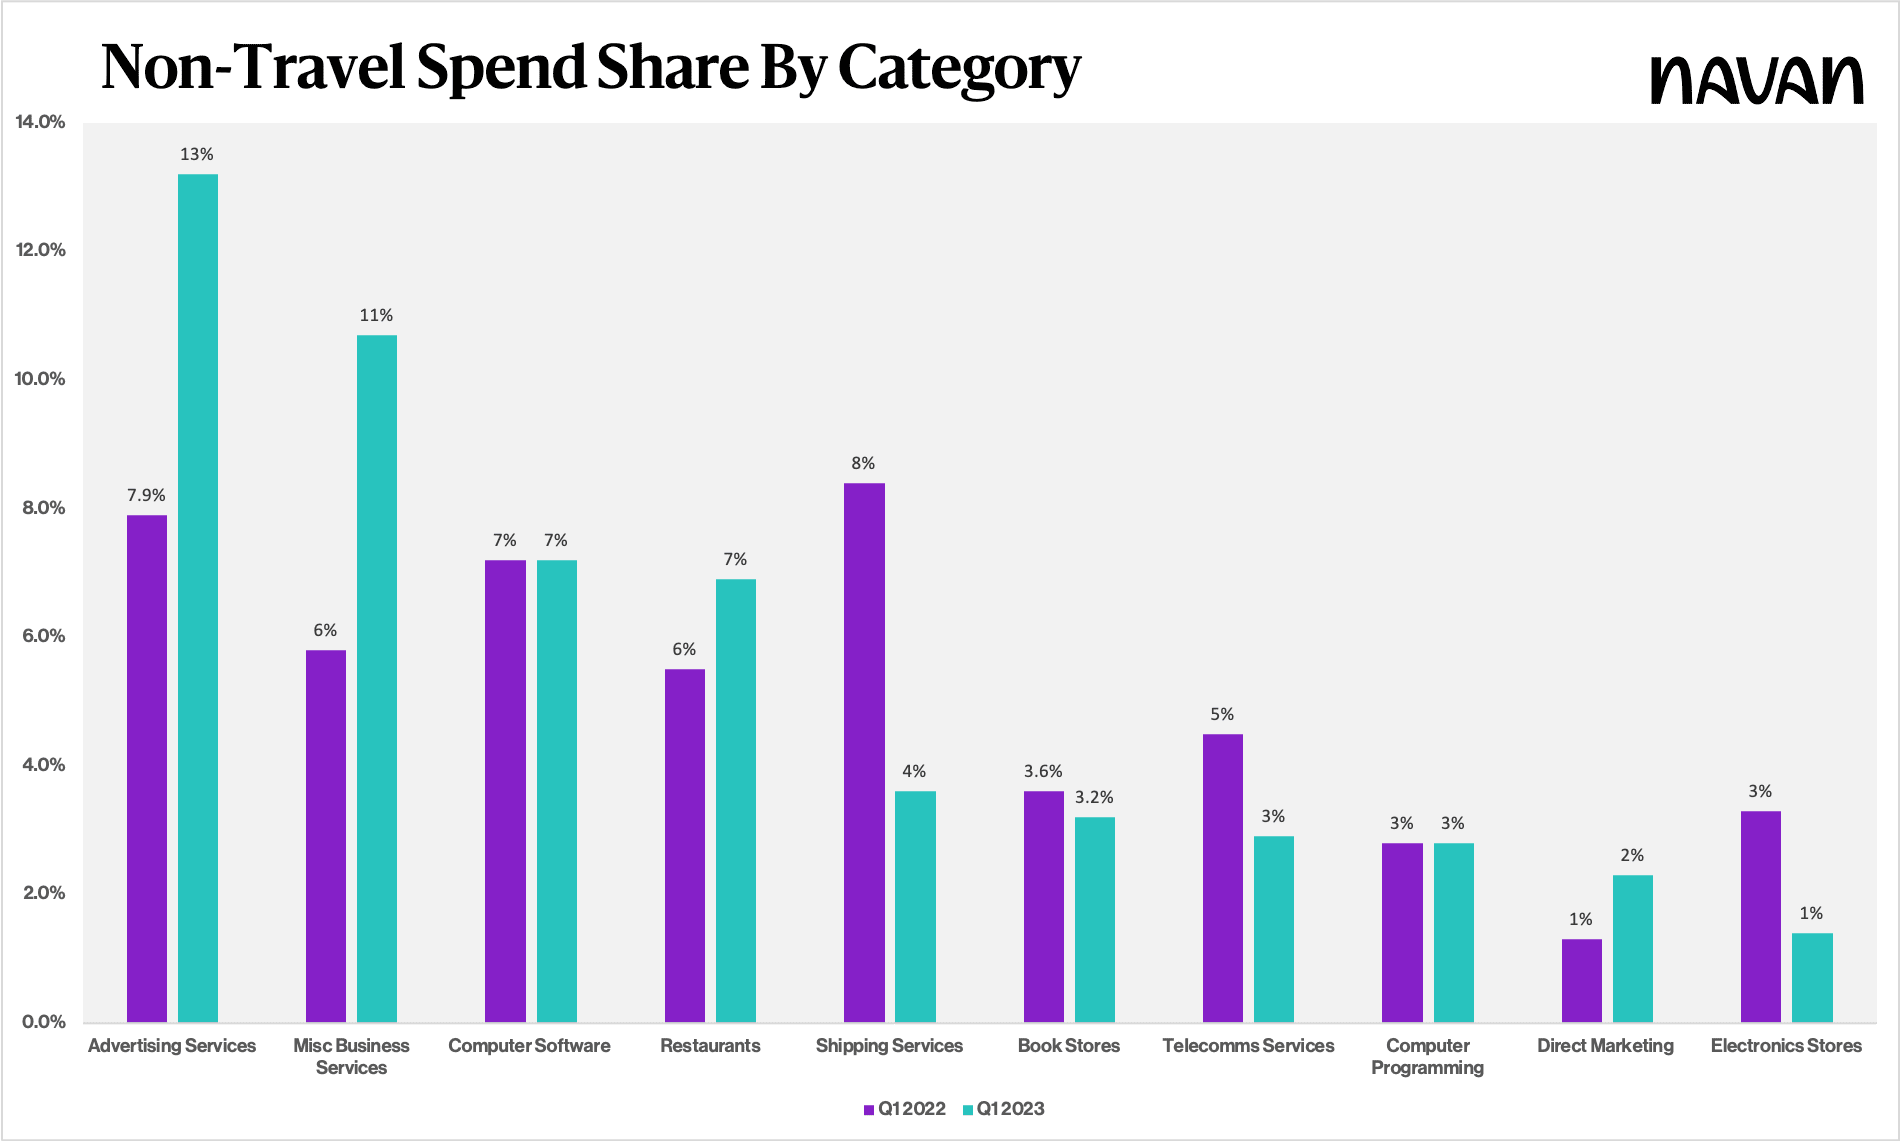
Non-Travel Spend
In Q1 2022, the No. 1 category for non-travel spend was shipping services (8.4%). At that time, the pandemic was still wreaking havoc on shipping services, with lost packages and delays making headlines daily. This area has since normalized; shipping service spend has dropped to 3.6% of non-travel spend.
But other spend has trended up. As companies compete for sales in a tightened macro environment, advertising — the second-biggest piece of the non-travel pie in Q1 2022 at 8% — jumped 5 percentage points in Q1 2023 and represents 13% of all non-travel spend. And as more employees return to the office, the shares of telecom services and electronic non-travel spend have decreased YoY.
Average Purchase Price
Here’s the Navan data on non-travel and travel purchase prices.
Average Purchase Price: Non-Travel
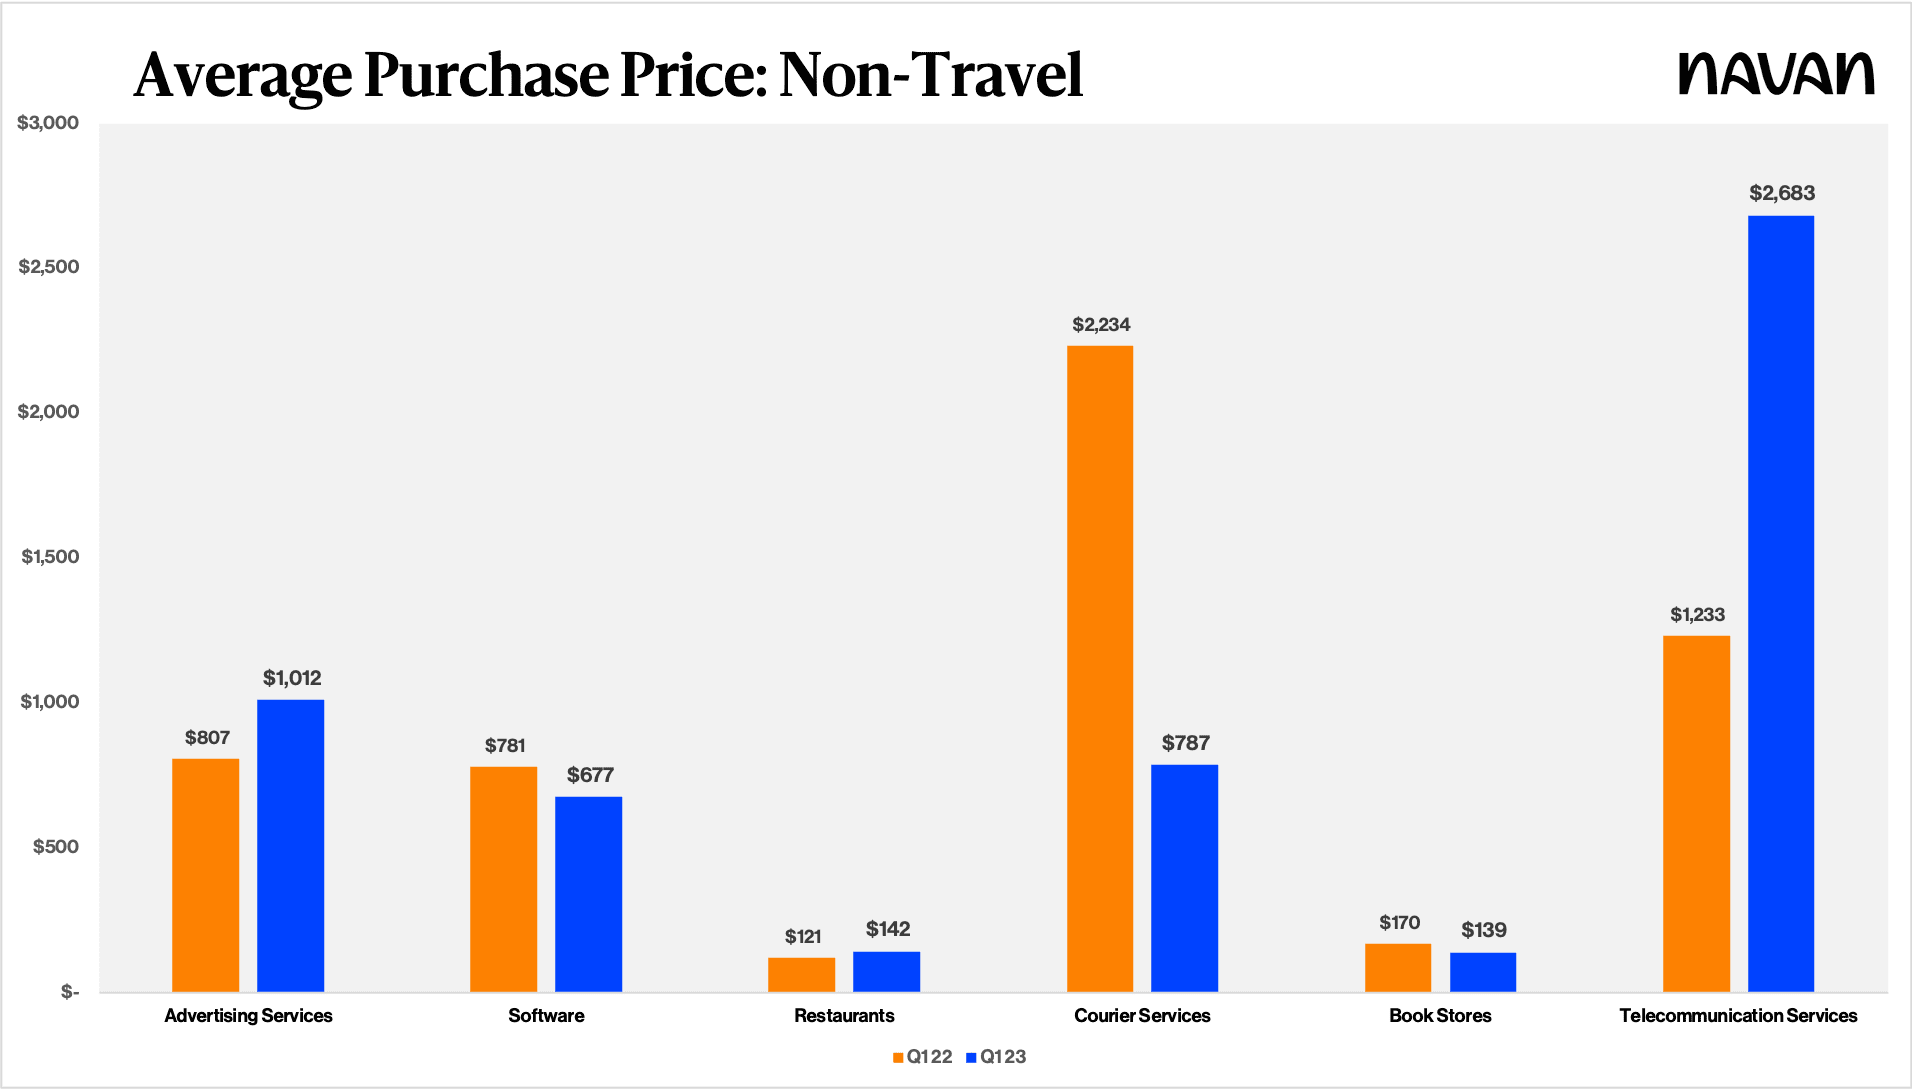
The cost of goods continues to have a large effect on how businesses are spending. The rate of inflation appears to be declining, but it continues to drive up the cost of goods. Still, whether inflation-driven or the result of a competitive sales environment, the purchase price of goods and services for non-travel expenses has undergone a significant increase, according to Navan data.
One area that has been particularly affected is advertising. The average advertising purchase has increased by more than 25% YoY, from $807 to $1,011, when comparing Q1 2022 to Q1 2023 — which could indicate that companies are bulking up on advertising in a competitive market.
Other services and goods, like courier/shipping services and software, decreased in purchase price, most likely due to a shift in business priorities. Shipping services have decreased more than 65% YoY, from $2,334 to $787 when comparing Q1 2022 to Q1 2023. And the average purchase price of software has decreased by more than 10% YoY, from $781 to $677, when comparing Q1 2022 to Q1 2023. However, unlike with advertising, the share of computer software has remained flat.
One spend category change that stands out among the others is telecommunications services, which increased by 118% YoY, from $1,233 to $2,683, when comparing Q1 2022 to Q1 2023.
Average Purchase Price: Travel
Companies utilizing Navan have effectively managed and controlled the costs associated with on-trip expenses by leveraging powerful tools like proactive, dynamic policy control. As also shown in our story on the state of business travel, companies have been able to return to travel while keeping costs under control by enabling their employees to spend company funds in a compliant and responsible manner.
Non-Travel Spend: Segment Trends
As businesses navigate the changing economic landscape, it’s essential to track how spending patterns are shifting across different segments. To gain a deeper understanding of these spending patterns, we analyzed how shifts in spending differ across segments while looking for trends and insights.
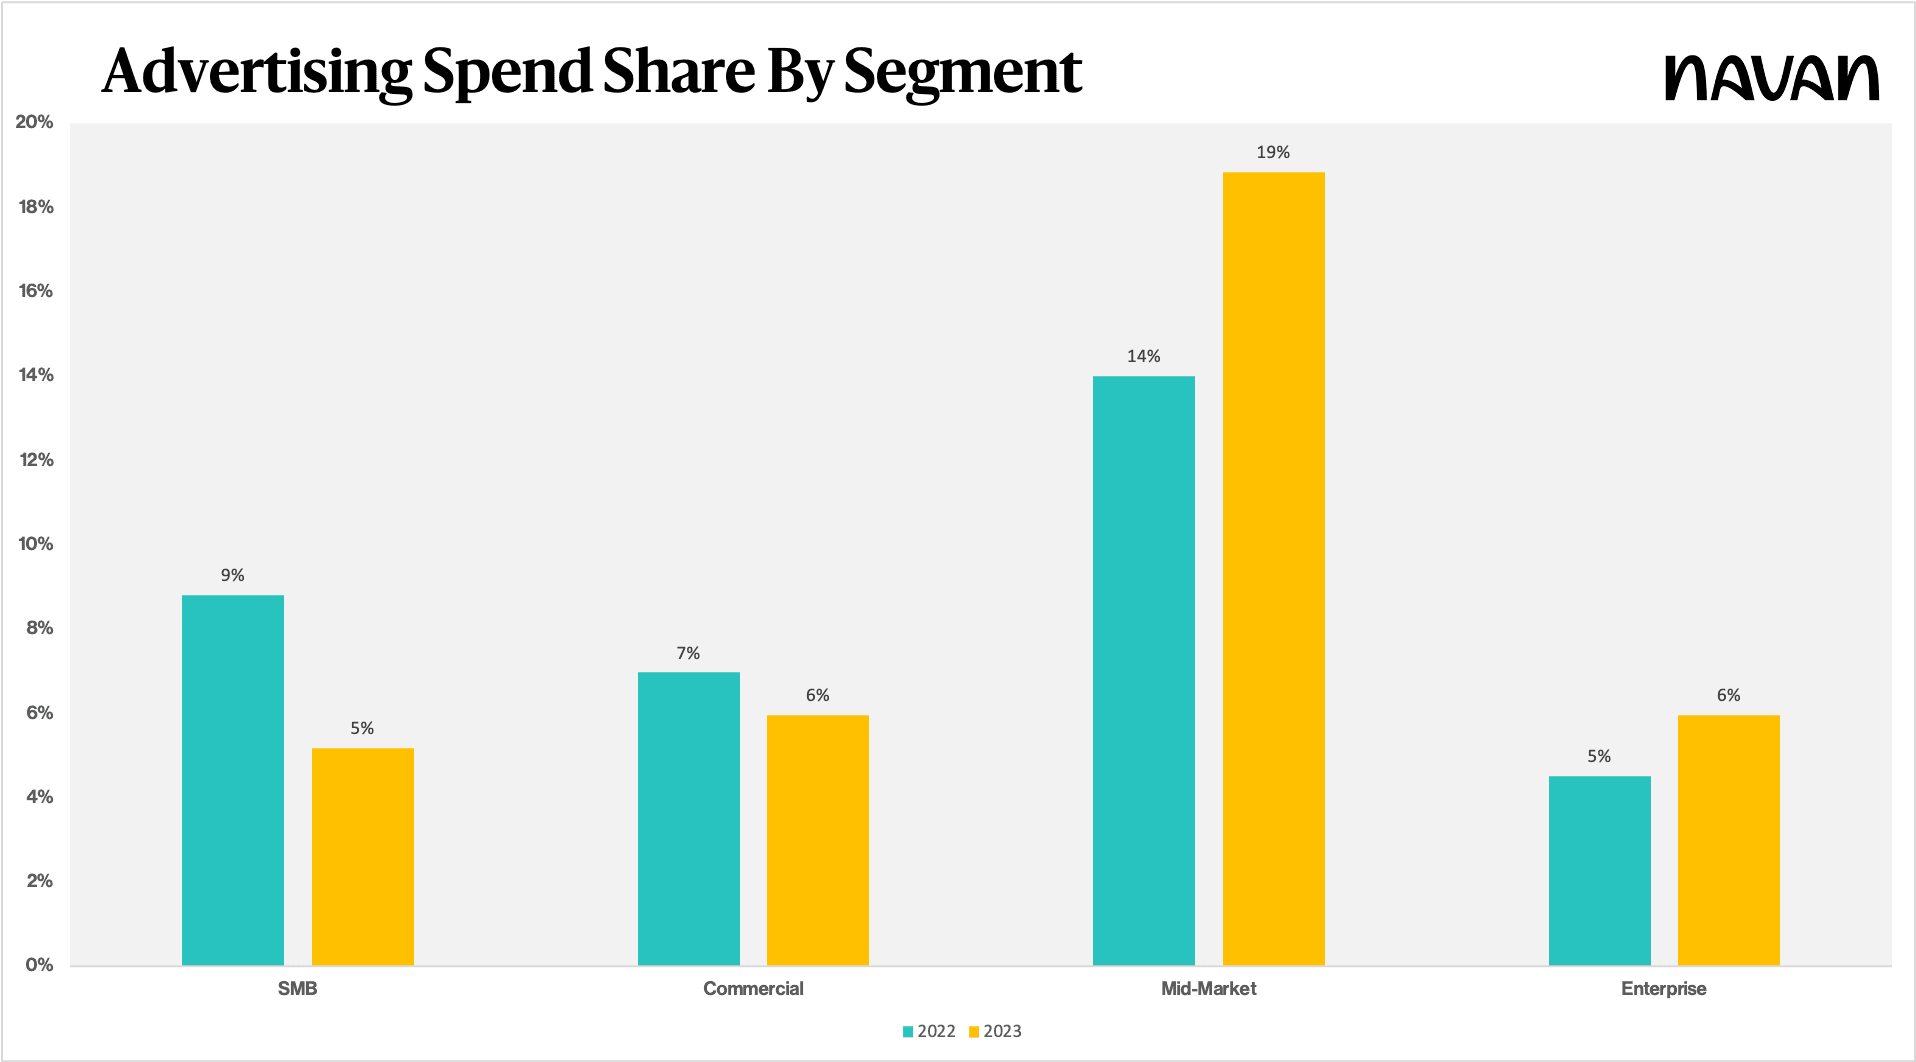
Mid-Market Shift on Advertising
As discussed above, businesses across all segments are increasingly focused on advertising to boost their growth and drive customer engagement. The increase has been driven mostly by mid-market businesses, where advertising as a share of non-travel spend has grown by 5 percentage points YoY when looking at Q1 2023 as compared to Q1 2022. While mid-market business spend in most categories remains steady, this segment allocated nearly 19% of its overall spend to advertising. The result has been a 14% change YoY compared to the 6% in Q1 2022. This investment in advertising can be seen as a strategic move by mid-market businesses to increase brand awareness, expand their customer base, and gain a competitive edge in their respective markets.
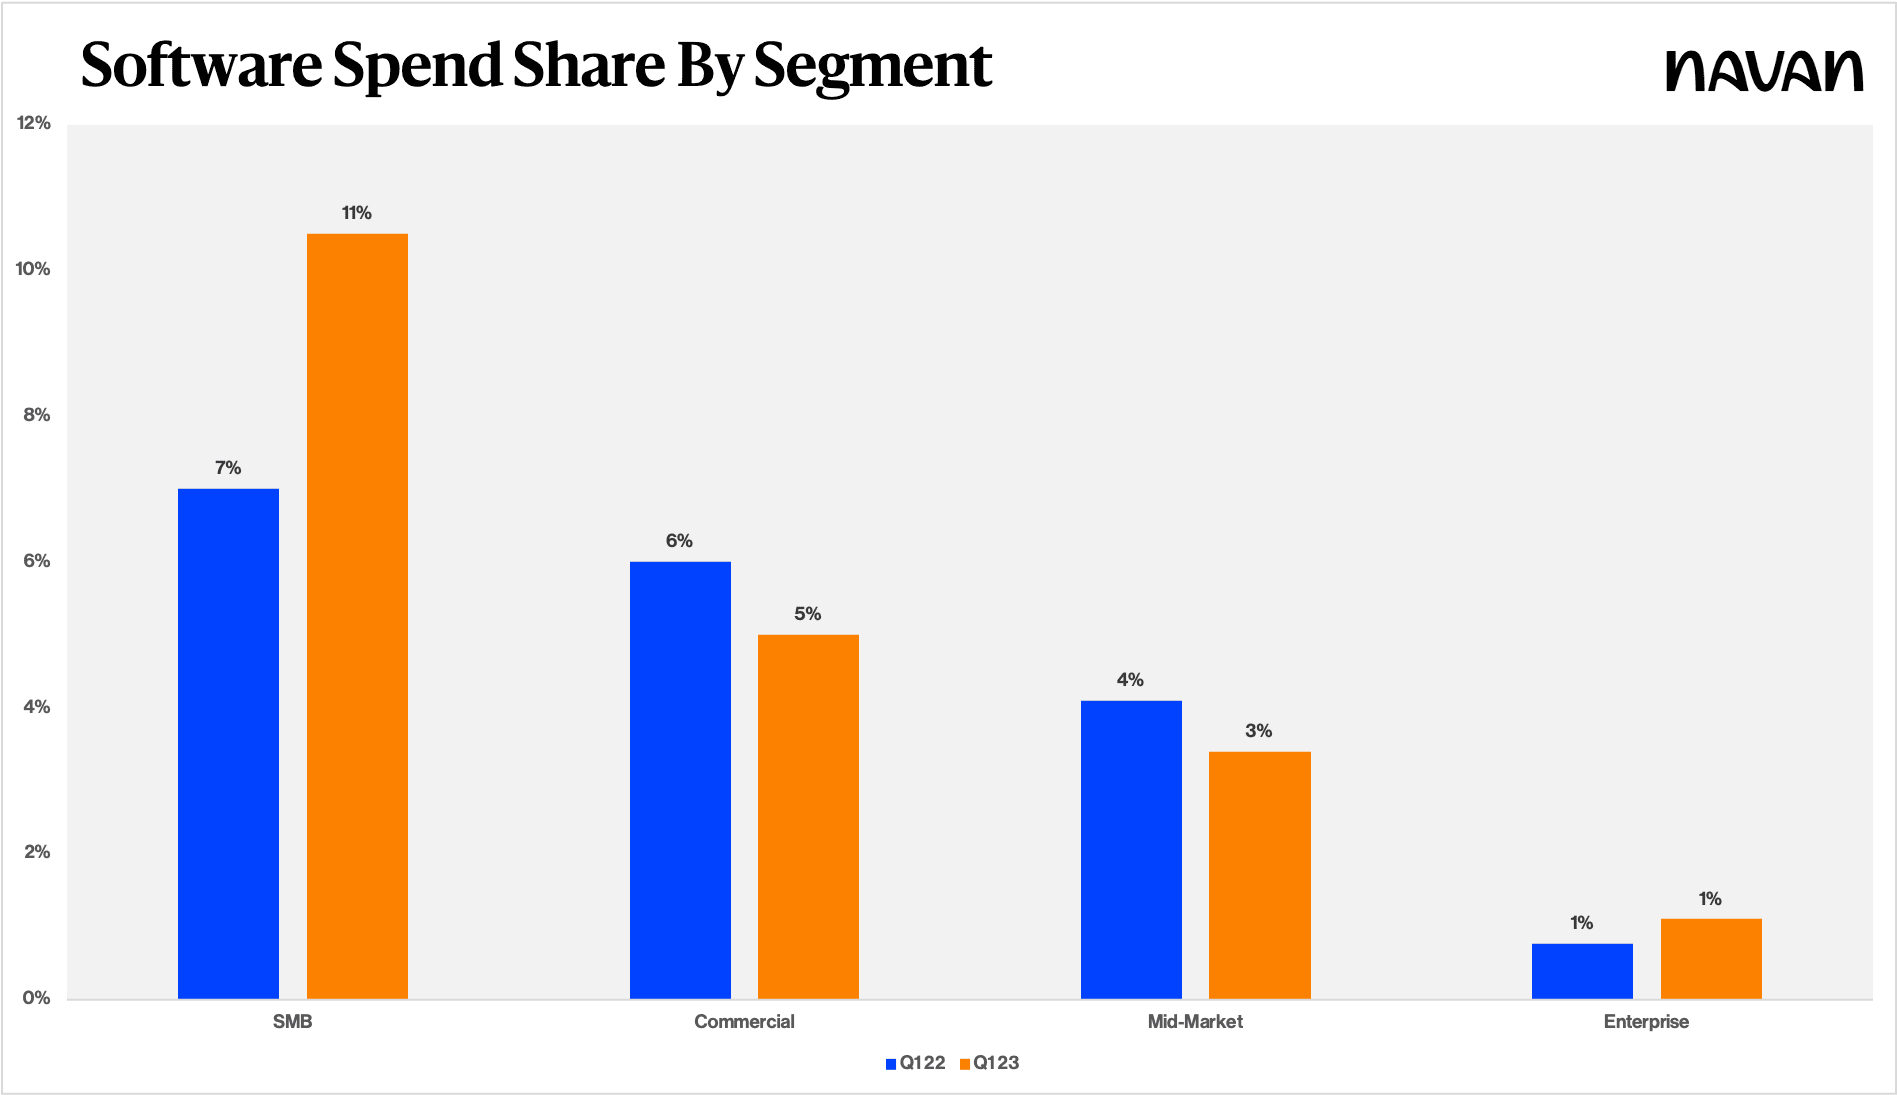
Small Businesses Increasingly Investing in Software
In the current business landscape, small- and medium-sized businesses (SMBs) with relatively modest budgets are prioritizing software investments as a critical driver of their growth and success. The segment allocated more than 11% of its total budget to this area in Q1 2023 — up 4 percentage points from Q1 2022. This trend underscores the growing importance of software in enabling businesses to improve their operational efficiency, streamline processes, and enhance customer experience.
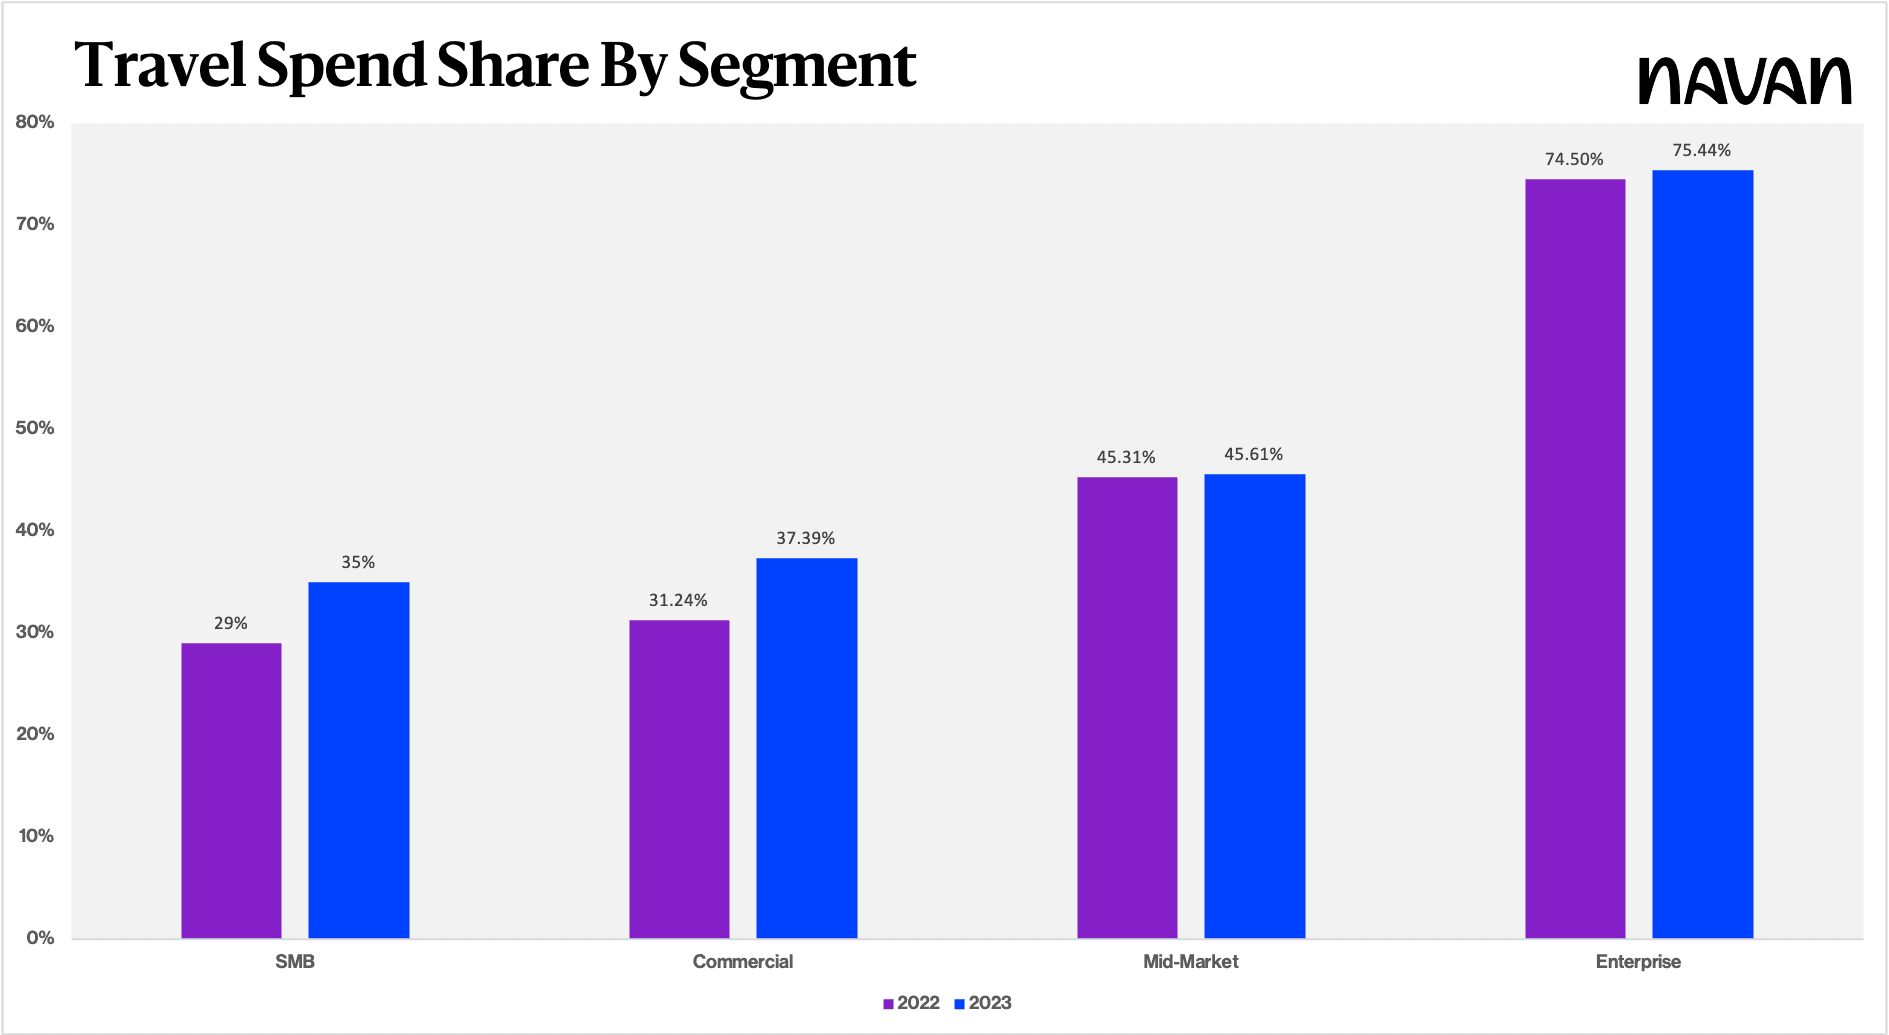
SMB and Commercial Segments Increase Business Travel YoY
While travel-related spend shares for the mid-market and enterprise segments remained flat from Q1 2022 to Q1 2023, the SMB and commercial segments have increased their travel spend as a share of their total spend. For both segments, that increase has been around 6 percentage points during this time frame. These increases represent a significant shift in priorities for these segments, with businesses prioritizing travel-related activities as a means to drive growth and improve business performance.
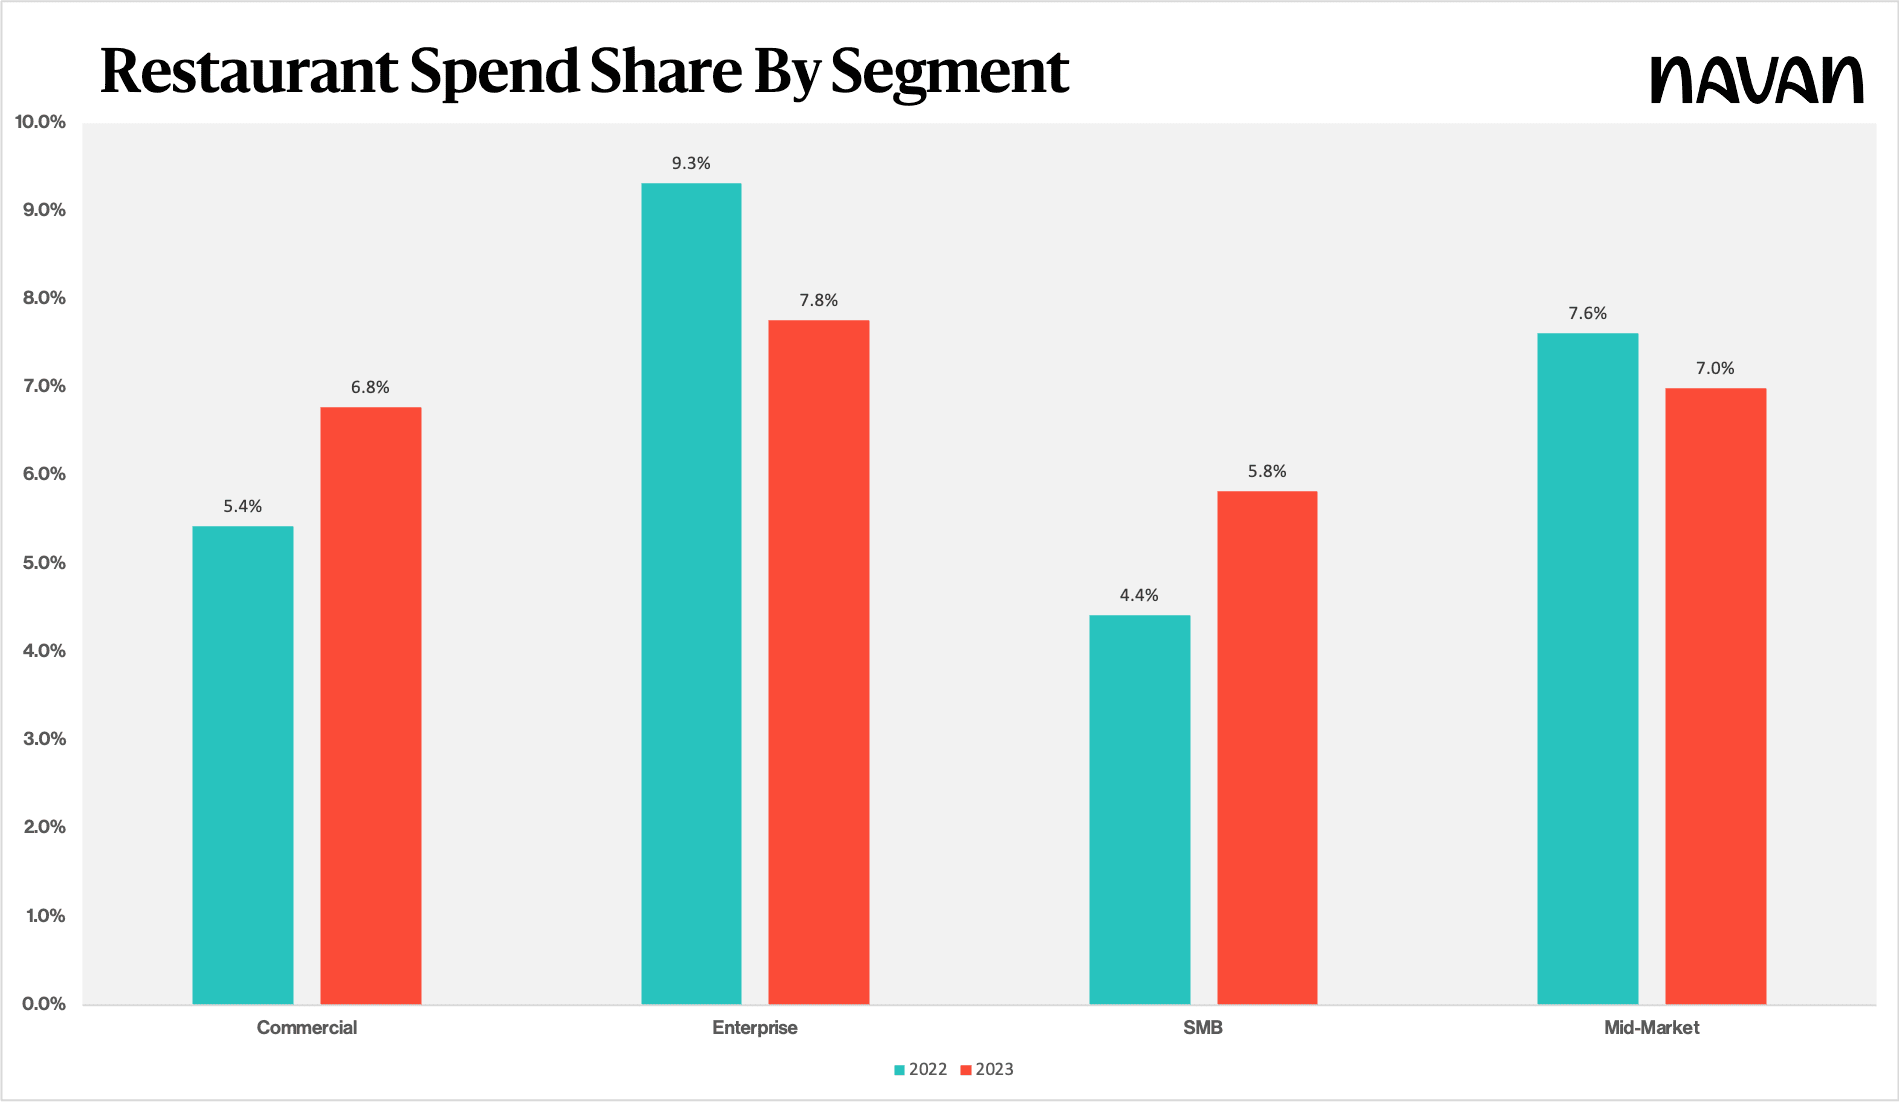
Restaurants for Non-Travel Events
SMBs and commercial businesses have increased their spending on restaurants for non-travel events by an average of +2% YoY. This category has emerged as a top priority for these businesses as they look to build relationships with clients, partners, and employees.
Businesses are eager to resume in-person events after the pandemic-induced lockdowns, and non-travel events are seen as a safe way to do so. Additionally, businesses recognize that these events are an opportunity to showcase their brand, build relationships, and foster a positive work culture — all of which can drive business growth.
Conclusion
Despite the gloomy predictions about the macroeconomic environment, businesses are refusing to pump the brakes on their spending. Instead, they’re cleverly adapting spending strategies to keep up with their evolving priorities.
Navan’s data unveils an astonishing surge in both spend volume and the number of transactions processed, painting a picture of an economy that is not only surviving but thriving. This remarkable growth speaks volumes about the optimism and eagerness of businesses to invest and expand.
Delving deeper into the analysis, intriguing patterns emerge within specific spending categories. One such trend is a laser-like focus on advertising, demonstrating a concerted effort to capture the attention of consumers. Conversely, companies other than SMBs seem to be dialing back on their utilization of software — a shift that raises questions about their changing needs and strategies.
As we approach the summer months, it remains to be seen if these trends will persist or if the business spend landscape will keep evolving.
Read more from this series:
This content is for informational purposes only. It doesn't necessarily reflect the views of Navan and should not be construed as legal, tax, benefits, financial, accounting, or other advice. If you need specific advice for your business, please consult with an expert, as rules and regulations change regularly.