TripActions Inflation Index: Q2 2022


With prices and economic volatility in the spotlight, inflation, and budgets were the hot topic in the second quarter of 2022, and those concerns had a major effect on corporate travel and expense programs.
It wasn’t all about cuts and hibernation though; instead, many companies shifted spend to accommodate the necessities of travel and continue cautious growth within a quickly evolving economic landscape.
To take a snapshot of current market conditions, TripActions delved into its corporate card-led expense management solution, Liquid, to find out which spend categories saw the largest increase in average price per transaction for 20 of the most popular spend categories.
The numbers are below; here are the trends we’re seeing.
Where Travel & Expense Program Costs Are Rising
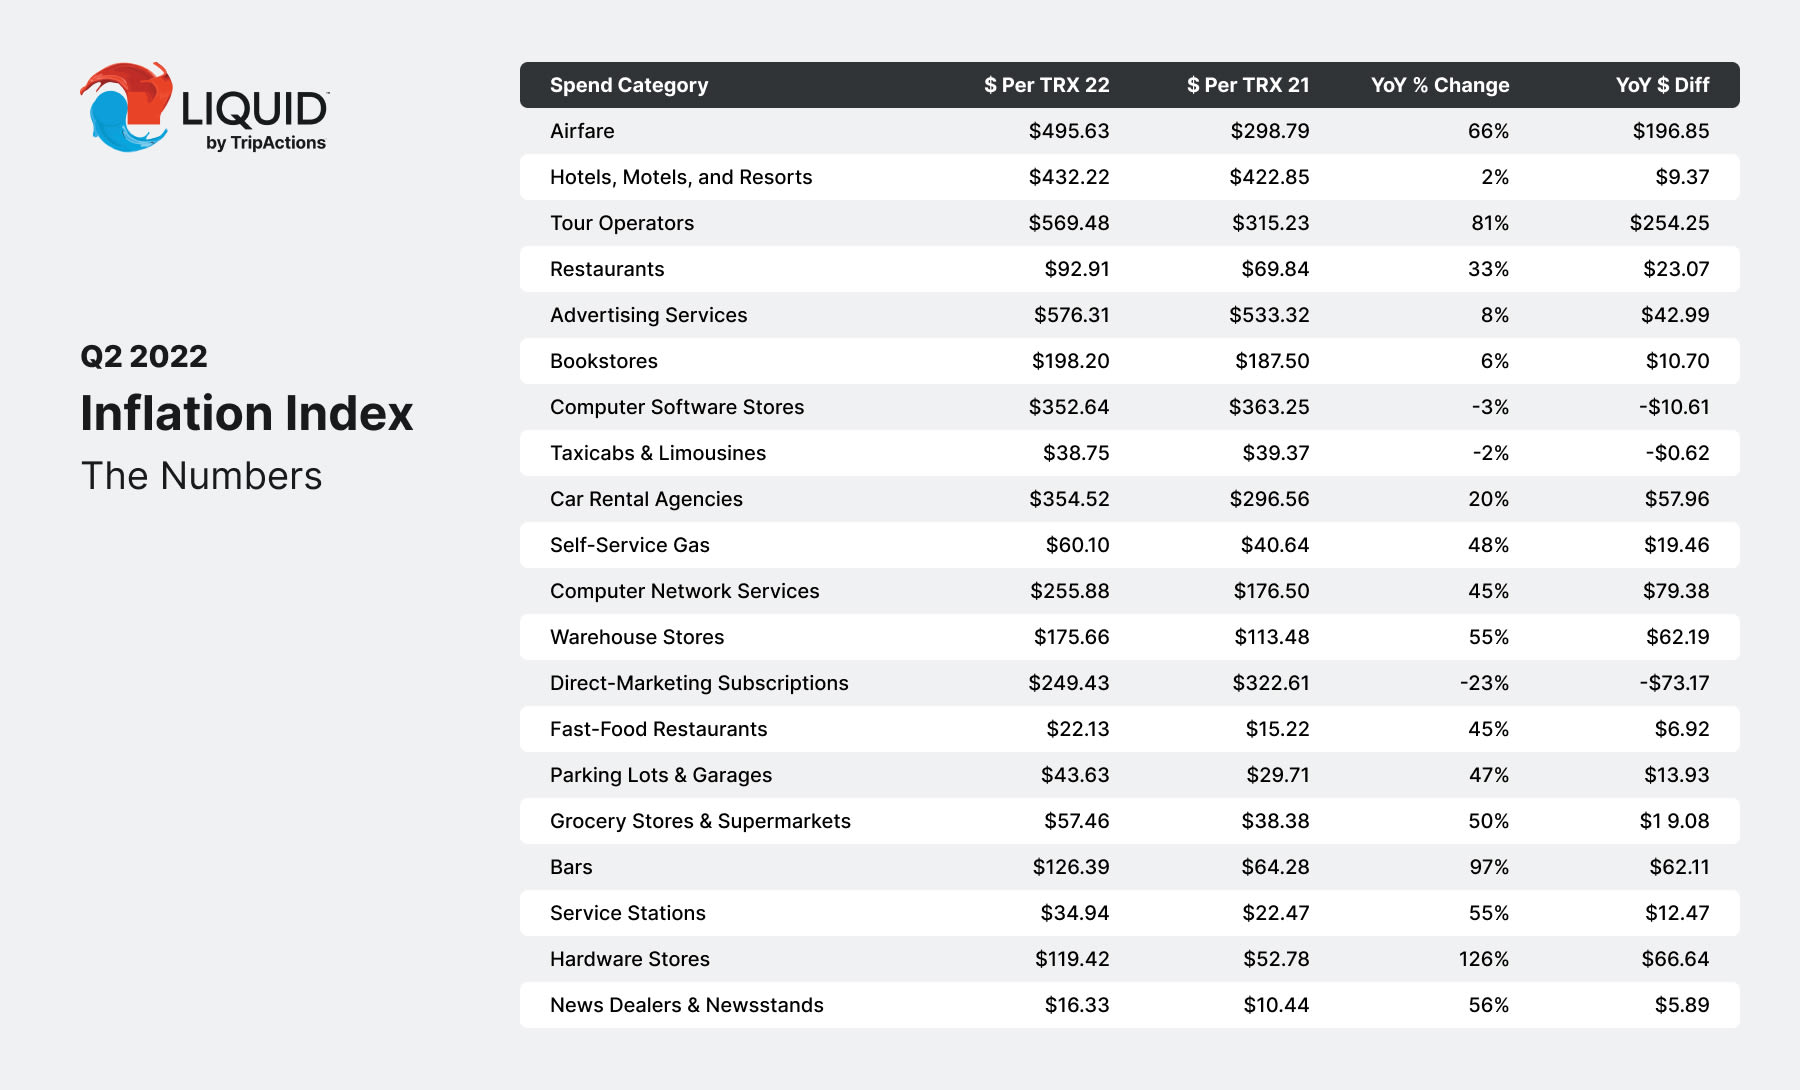
With global supply and delivery under pressure, it’s no surprise that gas and food prices saw major increases from 2021 to 2022. Year on year, companies are now spending 55% more per purchase at service stations and 45% more on fast food (though walk-in restaurants only saw an increase of 33%).
Industries tangential to these hot spots also saw increases. From 2021 to 2022, the average price of airfare went up from $298.79 to $495.63—an increase of 66%—while spend on tour operators went up 81%. These increases weren’t all due to the price of fuel though; staffing shortages and a surge in demand have strained the supply side of airline seats, pushing costs up irrespective of the cost of jet fuel.
Fortunately, some of that pressure is starting to alleviate. In the United States, domestic flight prices have already begun to decline; from May to July, there’s been a $70 drop in the average cost of airline tickets.
But increases in spend haven’t been restricted to the more expected categories; other segments of corporate spend also saw surprising growth. The average transaction amount at bars, for example, has escalated 97% year-over-year, reflecting an increase in demand for in-person meetings (and perhaps a much-needed happy hour or two).
Where Spend Has Decreased
Company bean counters can take some solace in the fact that not all spend categories are going through the roof. Direct-marketing subscriptions and computer software stores saw a year-over-year reduction in the average transaction amount of 23% and 3% respectively, suggesting that fewer employees are working out of home offices full-time. Limousine services also saw a slight decrease in year-over-year the average transaction amount, as comfortability with more forms of transit increases as the pandemic wanes.
Balancing Spend and Program Efficiency
Perhaps the biggest takeaway from this data set is that despite rising costs, travel and expense program managers have been able to shift spend to accommodate the demands of modern business travel—which, as Delta Air Lines recently confirmed, aren’t showing any signs of a slowdown.
Essential to this balancing act is having deep and immediate visibility into active spend and spend categories—a central component of the TripActions Liquid technology. With in-auth transaction approval and immediate spend visibility on dashboards, program administrators have the ability to track spend in real time and adjust policy as needed—a powerful capability when costs are vacillating so quickly.
Companies can also help drive efficiency through their road warriors and other employees who are swiping corporate cards. Fortunately, the granular policy controls of TripActions Liquid can limit or prevent spend by category, while the auto-itemization feature can instantly itemize restaurant receipts and hotel folios to separate out and automatically reconcile permitted expenses.
Ultimately, this balance of spend and efficiency should work in harmony, in order to create a modern travel and expense program that encourages travel and spend while keeping costs under control. And when the costs of airport luggage cart rentals or button-down Oxford shirts go through the roof, admins should be able to actively curb costs and encourage alternative ways for employees to get things done.
The Numbers
Here’s a look at the average amount per transaction processed via TripActions Liquid across the most popular categories and the respective year-over-year changes in Q2.
This content is for informational purposes only. It doesn't necessarily reflect the views of Navan and should not be construed as legal, tax, benefits, financial, accounting, or other advice. If you need specific advice for your business, please consult with an expert, as rules and regulations change regularly.