Insight Report | Modern Business Travel Benchmarks


Executive Summary
As predicted, business travel’s return to the global stage has now notched so many gains in 2024 that the question is no longer, “Is business travel back?” but “How much bigger will the market get?”
What’s driving these gains? First, it’s the continued popularity of hybrid and remote work models; second, the ever-increasing evidence that in-person connections are invaluable for business growth. After all, while Zoom chats have become daily occurrences for many of us, the high volume of business travel tells the full story: Face-to-face meetings remain the gold standard for how teams are built, deals are closed, and business gets done.
But while the volume of business travel is rising, business travel booking patterns — and the profile of travelers — have shifted, perhaps permanently. Sales teams are back in force, and that return in volume is layered onto the increase in meetings and events (i.e.: conference travel) and office visits. While we hesitate to call anything the “new normal,” it does seem like companies have found a balance that works.
In fact, balance is something that more and more business travelers crave, based on the increase we see in blended — or bleisure — travel. Tacking on a couple of days to a work trip seems to have become more than a “nice to have” for employees.
Of course, that’s just the high level. We dug deep into Navan’s data and compared it to 2019 to establish the new benchmarks of modern business travel. What we found is a revealing look at how businesses are using travel to help drive company growth post-pandemic — and the behavior of business travelers today.
Let’s go.
Key Insights
• Office visits: from 28% to 33% (+5 percentage points)
• Conferences: from 12% to 15% (+3 percentage points)
• Customer visits: have returned to their pre-pandemic share from 26% to 27%
Part I: Business Travel Recovery
2019 Cohort Travel
To get a clear look at the recovery outside of Navan’s growth since 2019, it’s necessary to isolate a cohort of current customers that have been with Navan since 2019; that way, we can identify how those particular customer booking volumes compare over time to their respective 2019 levels.
In analyzing that data, we see clear evidence that road warriors have returned to the road — and at higher levels than in 2019. Unsurprisingly, it’s been a bumpy ride since 2020, but the level of travel has hit a sustained pace.
Here’s what that recovery looks like linearly.
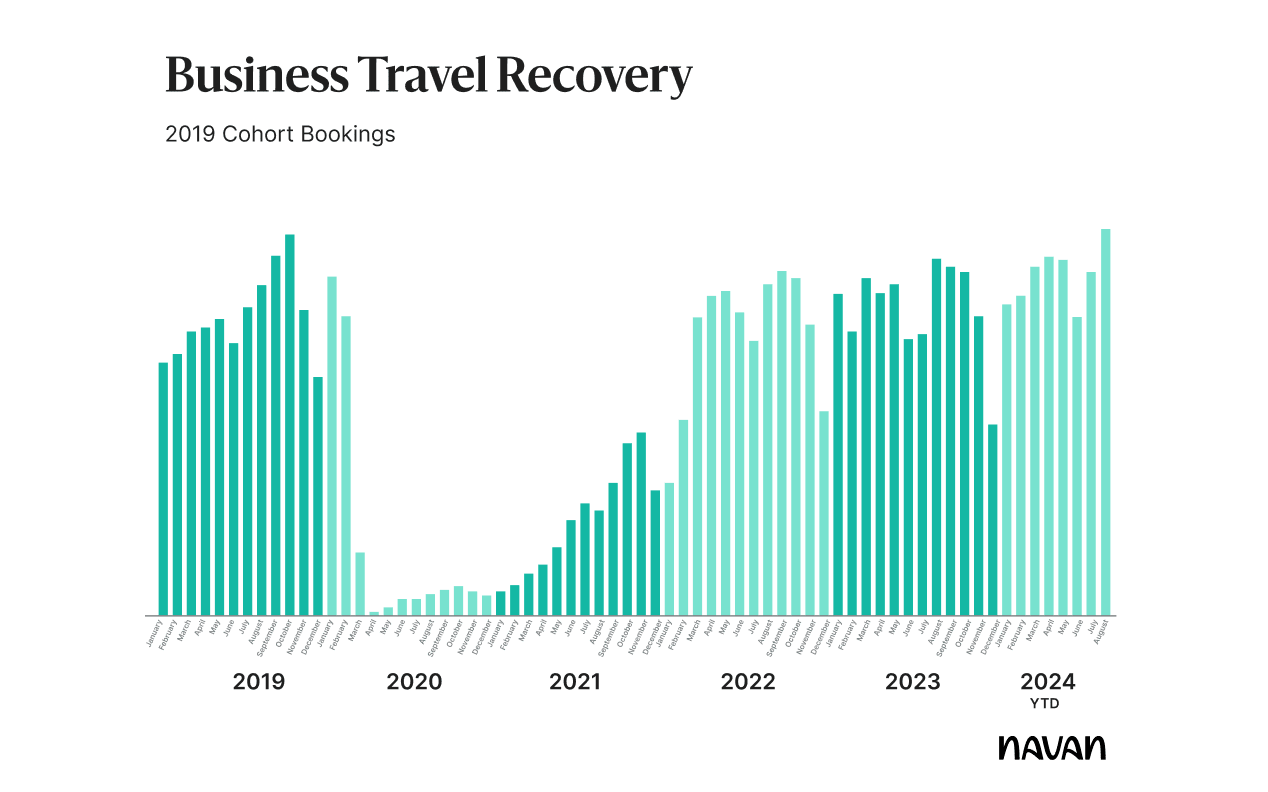
That recovery becomes even clearer when you break down the data by month in a heat map. Here’s the same data as in the chart above, but represented as a percentage of the 2019 monthly business travel booking volume for the 2019–2024 customer cohort. For example, the April 2020 booking volume was 2% of the volume in April 2019, while April 2024 recorded 124% of the April 2019 booking volume for the same cohort of Navan customers.

While the 2019 cohort bookings are up, it’s nothing compared to the total volume of bookings made on Navan over the same period of time. This growth —

More Travelers per Company
We know that travel bookings have exceeded pre-pandemic volumes, but we were curious about the factors driving those numbers up.
Isolating mid-market companies (at Navan, we define this as companies with 651 – 3,000 employees), we can see that the median number of employees booking travel has increased since 2019: In August 2019, the average mid-market customer had a median of 81 individual employees booking travel. In 2022 — when remote work models dominated — this hit a median of 136. August 2024, with hybrid models the norm and large return to office pushes, saw a median of 129 — lower than 2022, but 1.6x higher than 2019.

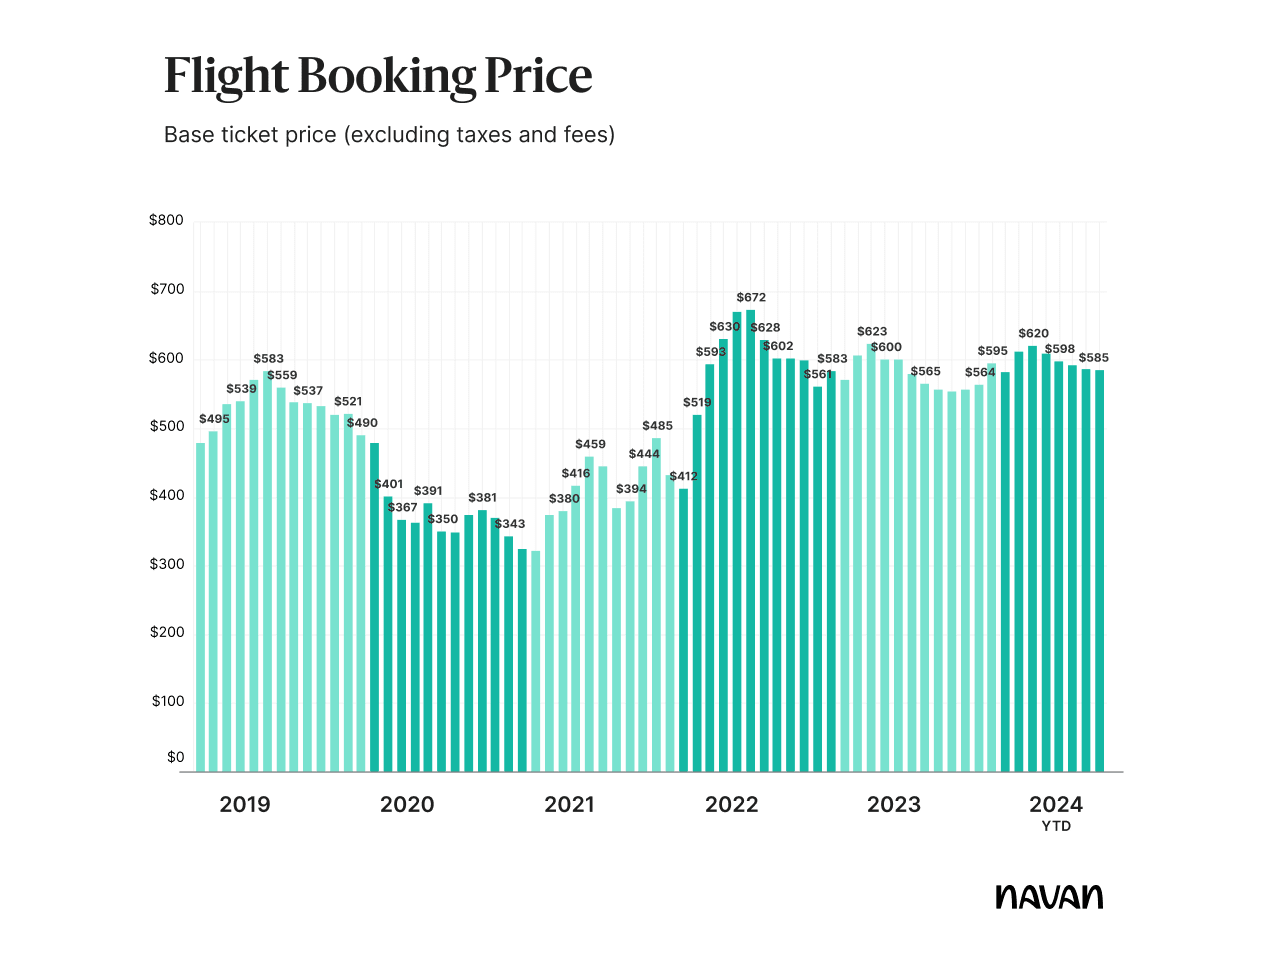
Flight Booking Prices
Of course, booking volume isn’t the only marker for recovery. The pandemic saw increased inflation, coupled with sky-high demand, sending travel prices soaring. Average flight booking prices (all cabins and fare classes, domestic and international combined) peaked at a whopping $672 in July of 2022.
Yet booking prices on Navan have dropped considerably since the July 2022 peak. They’re just 2% higher, on average, than the equivalent month in 2023, with August 2024 recording the highest YoY increase at 5%. (At $585, July 2024 was $172 less expensive on average.)
Interestingly, this decrease occurred as Navan has ramped up our number of NDC connections. (See our deep dive into this data in the NDC Savings Index.)
Since 2019, the total flight price per mile is up 20% ($0.05), with taxes and fees up 25%. For domestic flights, the base rate is up 11% and the total price up 12%; for international flights, the base price is up 33%, with the total price up 36%. (Taxes and fees for international flights increase at a higher rate, since airlines add the international-only fee of fuel surcharges.)
Flight Booking Lead Time
Along with flight prices, flight booking lead times have increased steadily for every segment of the business travel market, with enterprise companies making the largest jump: 6.2 days.
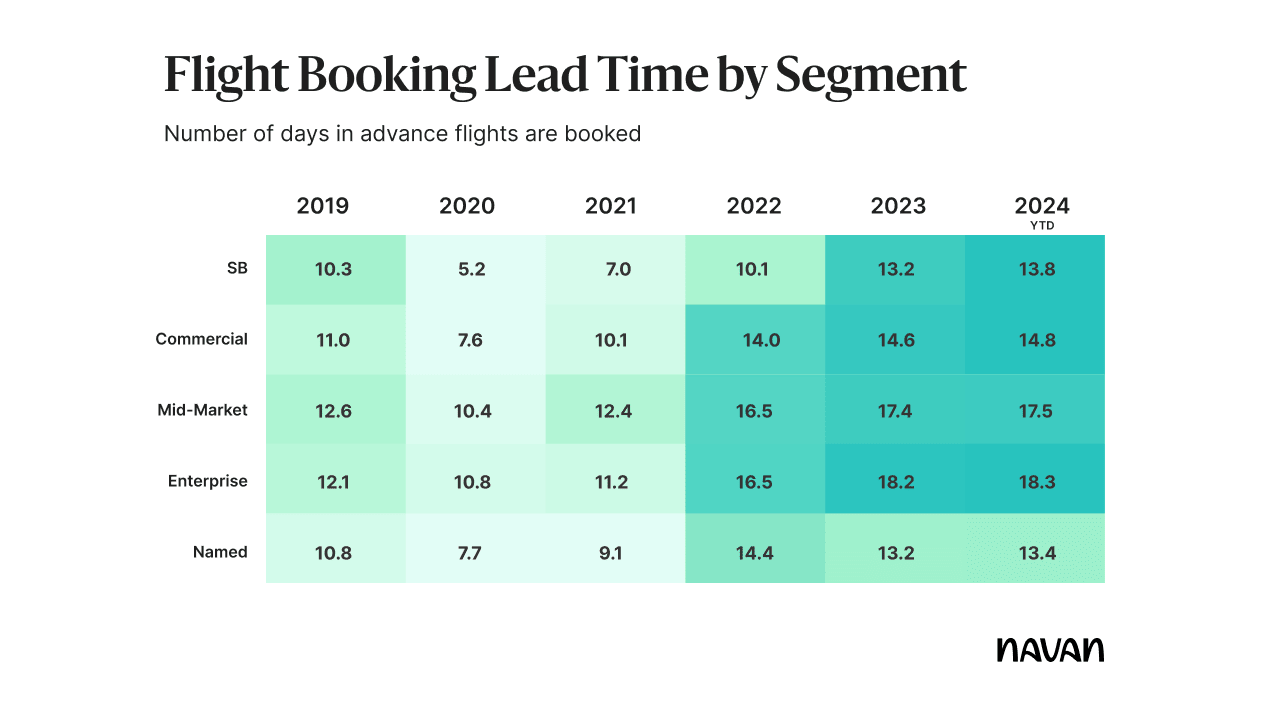
Without the disruptions of the pandemic — but prices still elevated — it’s not surprising to see a resurgence of pre-planning, which brings associated savings (something businesses were looking to maximize as inflation rose).
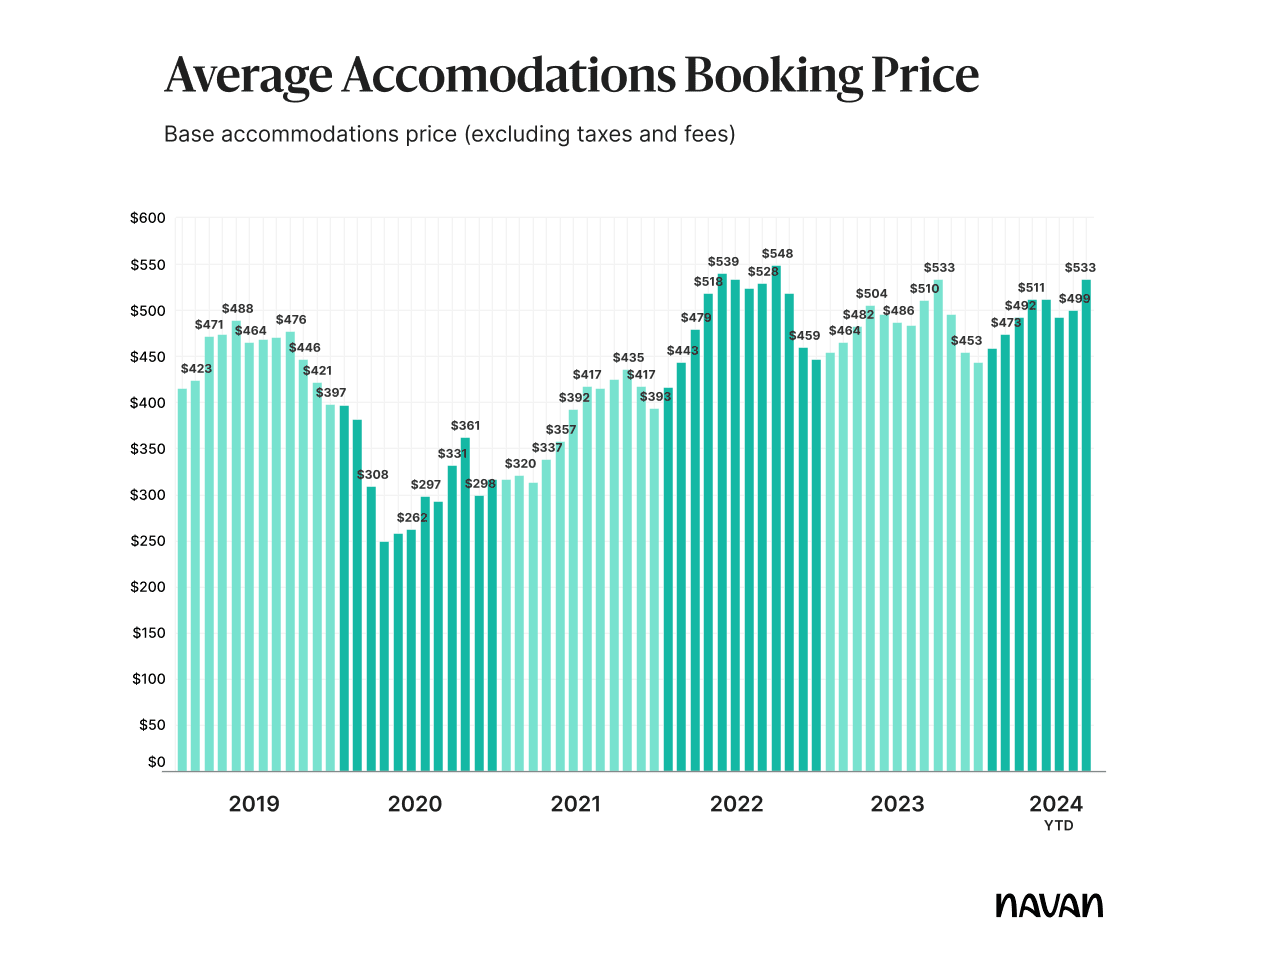
Accommodations Booking Price
Part II. Shifts in Modern Business Travel
We’ve been keeping a close eye on shifts in booking patterns and business travel behavior for a while now. We long predicted that the pandemic-era rise in remote and hybrid work models would lead to transient workforces and an increase in business travel volume from teams needing to get together for on-sites and team meetings.
And indeed, Navan data show that the reasons for travel have shifted perceptibly over the past few years.
Navan tracks trip purpose within the booking process and we have observed a marked increase in the share of travel for internal meetings and office visits — from 28% in 2019 to 33% to date in 2024 (+5 percentage points) — as well as for meetings and events (like conferences), which has increased 3 percentage points, from a 12% share of travel in 2019 to 15% to date in 2024.

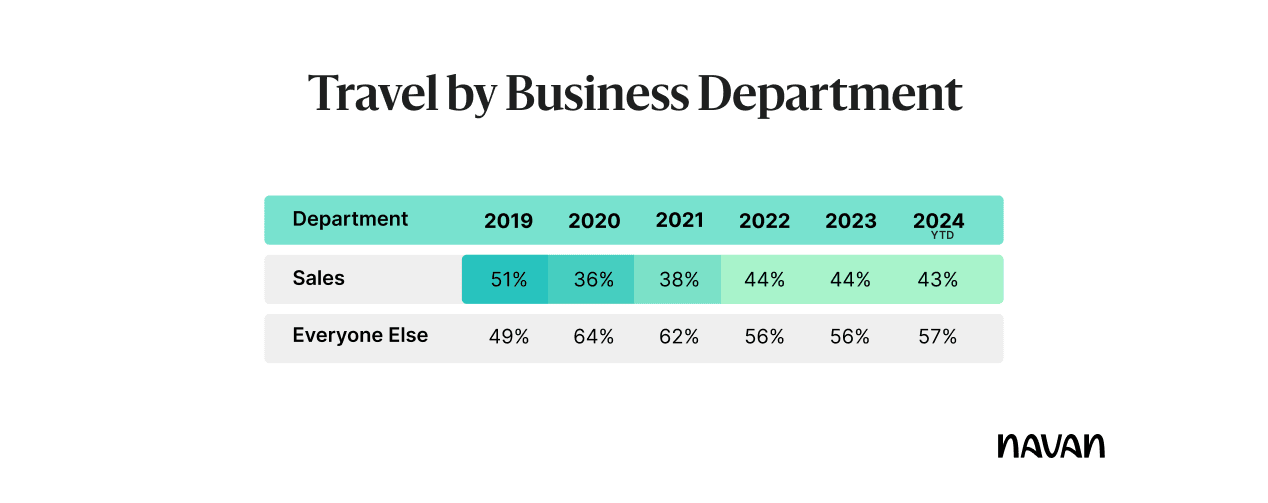
That said, sales teams still represent the lion’s share of travelers by department. Navan analyzed booking data across segments and all booking types, both international and domestic, and found that from closing deals to customer check-ins, handling business in person has become perhaps even more important than pre-pandemic.
Still, the post-pandemic shift does seem to have settled into a regular pattern: Since 2019, sales teams have dropped from a 51% majority, and over the past three years have leveled off at 43 – 44%, with little or no variation by year.
Who Is “Everyone Else?”
Other departments have settled into patterns of their own, with clear shifts happening over the past three years. Within this larger, non-sales group, engineering and operations teams make up the largest percentage of travelers (12% each in 2024 to date, up 2 and 4 percentage points, respectively, from 2019), with marketing coming in at 10% (+2 percentage points), finance and admin at 8%, product at 7%, and two groups — executives and HR — rounding out the list at 4% (+1 percentage point each).

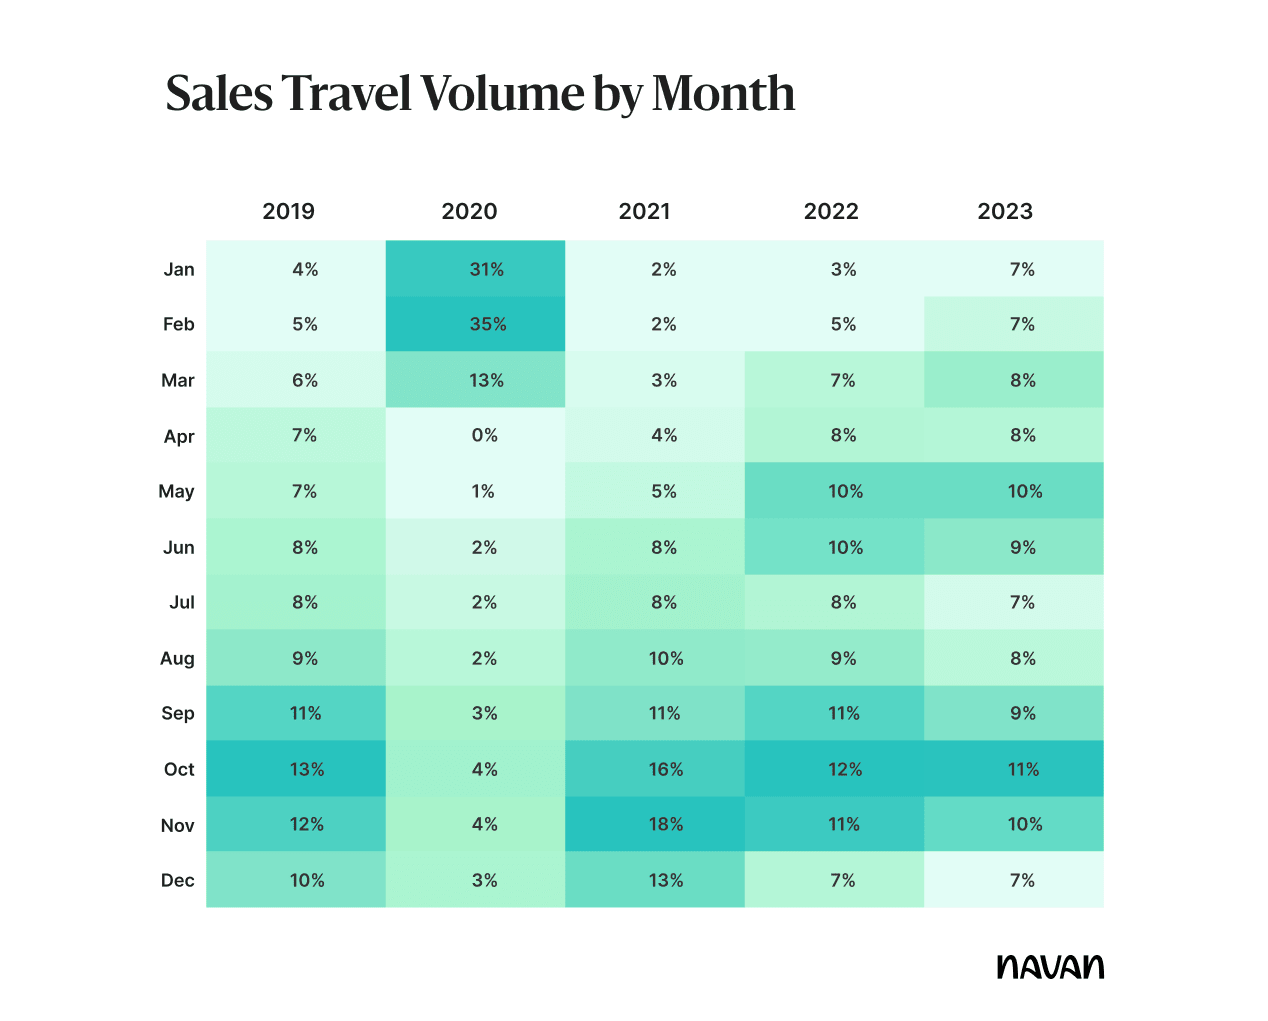
When Are Sales Teams Traveling?
Since sales teams still comprise the largest portion of business travelers — by a lot — we looked at what times of year they’re on the road the most. And while fall conference season remains popular, we’re seeing an uptick in the spring/early summer months — perhaps the hot new season to close deals.
Booking Mix: Domestic/ International
Just how global is the world becoming? One clue: Since emerging from the restrictions of the pandemic, international travel has continued to climb at the expense of domestic (for all countries). International flight bookings on Navan are up a full 9 percentage points since 2019, with a corresponding decline in domestic flights.

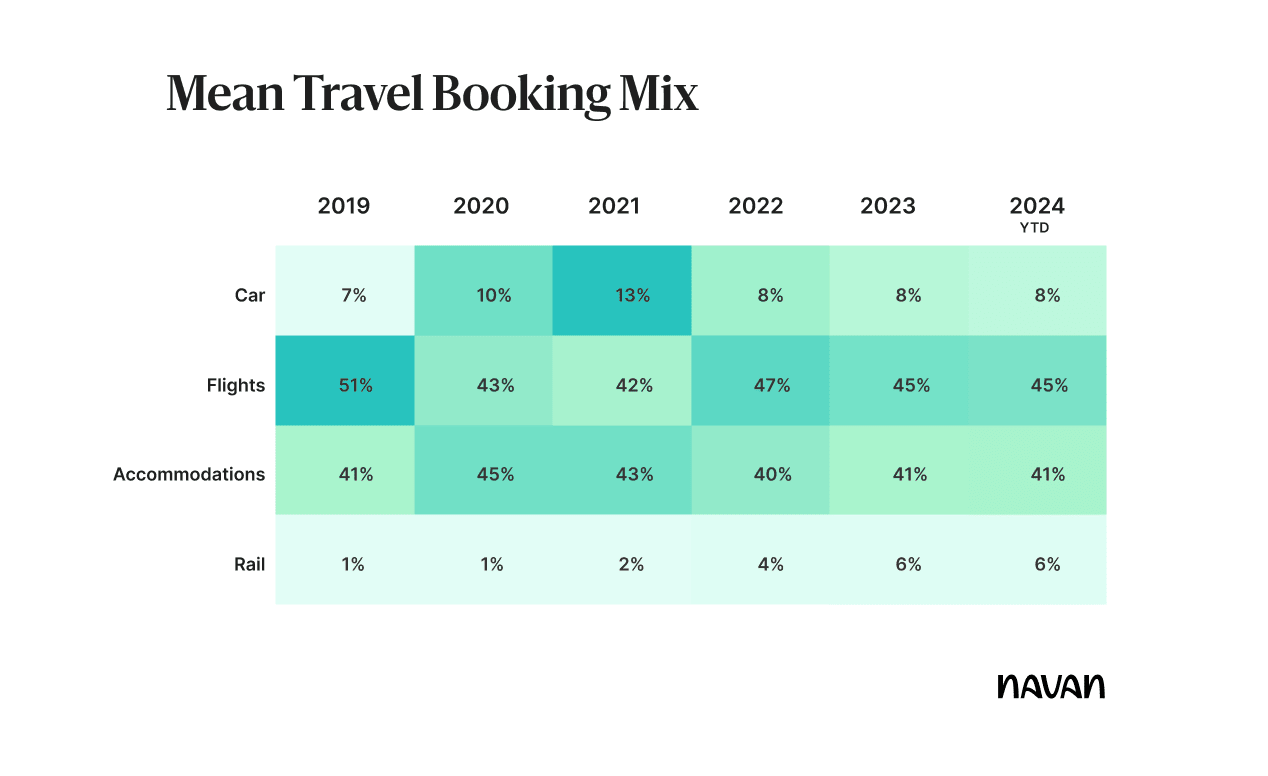
Rail on the Rise
Train travel may be entering a new golden age, thanks to a heightened emphasis on emissions tracking and ESG reporting, especially in Europe. (France has imposed several rules requiring travelers to choose rail over flying when equivalent routes are available.)
The growing popularity of rail, with a similarly sized decline in flight bookings, indicates that this shift may be here to stay. Rail bookings have been inching up since 2020, moving from a mere 1% to 6% today, while flights have dropped 6 percentage points since 2019.
Part III. Bleisure Season
A new pattern we’ve been tracking? The rise of blended trips alongside the confluence of shoulder season — when travel prices typically drop — and conference season, when business travel peaks.
Fall Conference Season
This fall will be a busy one. Forward bookings for the season — reservations made from January 1 to Aug 31, 2024 — are up 2X YoY, compared to 1.6X at this time last year. If you’re hitting the road at this time, you won’t be alone.

Blended Trips
What do you get when you combine a high level of business travel and a softening in consumer travel?
One answer: more employees making the most of those business trips by adding on some personal time. After all, why not enjoy the destination your job has sent you to? And the most popular time of the year to do just that is upon us — fall shoulder season, when the weather’s still great but prices and crowds decline.
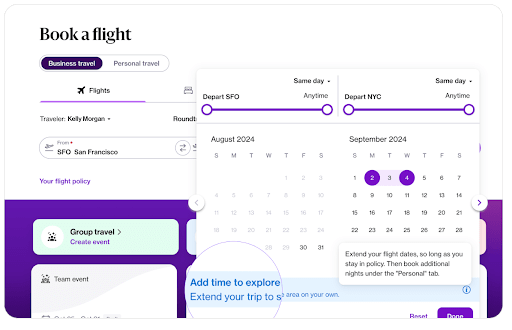
Those are just the beginning of the findings we unearthed by looking at trends in bleisure travel bookings on Navan over the past few years. In fact, bleisure bookings are something we’re uniquely positioned to track: Navan’s “Extend Your Stay” feature makes it easy for travelers to add leisure days to a business trip through our personal travel platform. Business and leisure bookings are bundled into the same trip, while keeping the traveler’s personal booking details hidden from the company.
By analyzing travelers who have used this “Extend Your Stay” feature — plus concurrent business travel and personal hotel bookings — we got a clear and insightful picture of what business travelers are up to when they’re still on location but off the clock.
Here’s what we learned.
Bleisure Trip Volume is Soaring
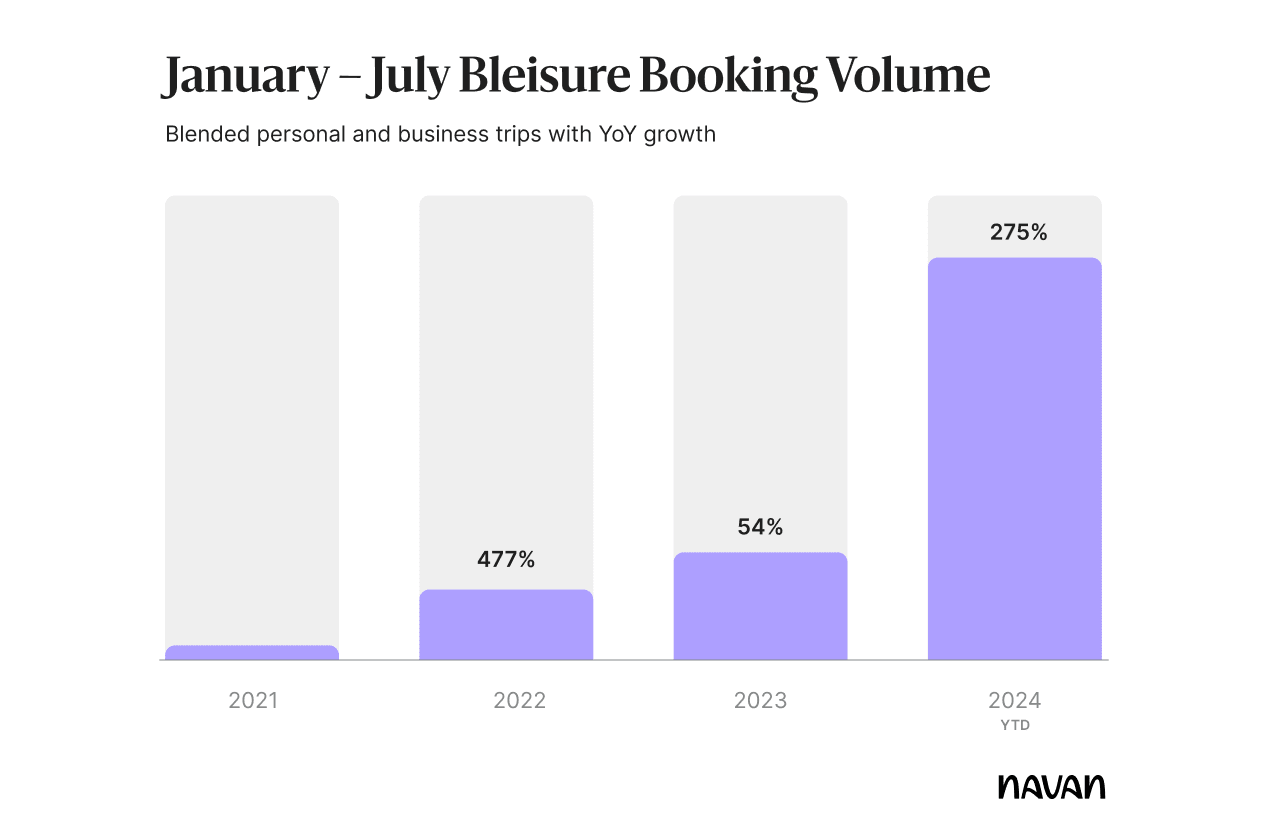
Overall, the volume of bleisure travel bookings on Navan is up a whopping 275% (nearly 4x) increase in these bookings compared to this time last year — and that’s before the popular fall shoulder season begins. And the annual volume has grown at an astonishing rate over the past few years as bleisure trips have increased in popularity.
Here’s what that looks like linearly and then by booking growth, using year-over-year data from January to July since 2021.

A Season for Everything
For Navan’s travelers, the popularity of blending work time and “me” time starts rising when the leaves start dropping. From 2021 – 2023, bleisure travel bookings with a trip start date from September through mid-November comprised 46%, 33%, and 38% of yearly bleisure travel volume, respectively.

The Trend Continues
This year’s fall shoulder season is following the by-now-familiar pattern. Forward bleisure bookings (those made from January 1 – August 25, 2024, with travel dates from September 1 – November 16, 2024) have jumped an eye-opening 83%.
The traditional drop in prices from summertime highs can only be helping. From September 1 to October 31, 2024, airfares are down 14% ($152) compared to summer bookings, while average hotel prices are down 6% ($11).
And travelers are apparently anxious to get out there: Blended travelers are booking further in advance this year, compared with an equivalent booking window and start dates last year.

Here’s How Bleisurers Bleisure
How long is the typical bleisure extension, and how much are people spending? The average length of personal time — right around 2 days — has proved remarkably steady from January 2023 until now. Cost-wise, it’s no surprise to see that the average outlay climbs alongside the temperature.

Rewarding Behavior
Navan — the first TMC to incentivize employees for saving company money — has always understood the power of rewards. As leisure travel boomed in the post-pandemic era, frustrations intensified around the value that loyalty programs were delivering. So Navan shifted from a gift card-based incentive program to one that enabled business travelers to earn travel credits simply by following company policy.

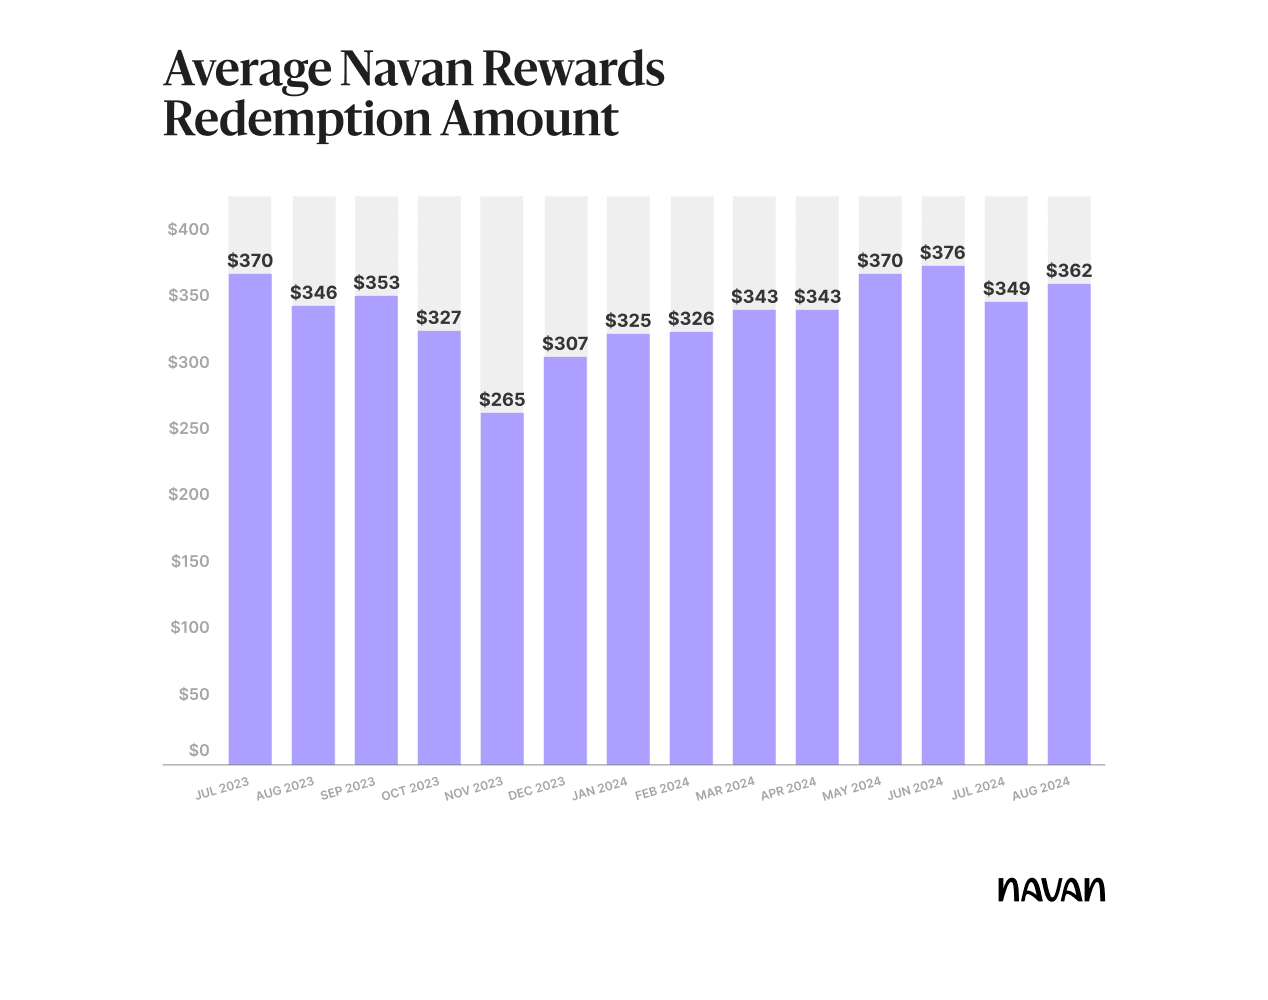
Now, not only are travelers racking up rewards, they’re putting them to work by using them to offset a portion of their bleisure extension costs. And, as you may expect with the pullback in consumer travel spend, Navan Rewards are being redeemed at higher rates than ever. In July of this year, the share of bleisure bookings that included rewards redemptions grew more than 20 percentage points YoY, from 13.5% to 34.1%. The average amount of these reward redemptions, though, has held fairly steady over the past 18 months, usually falling between $350 and $370.
The Hot List
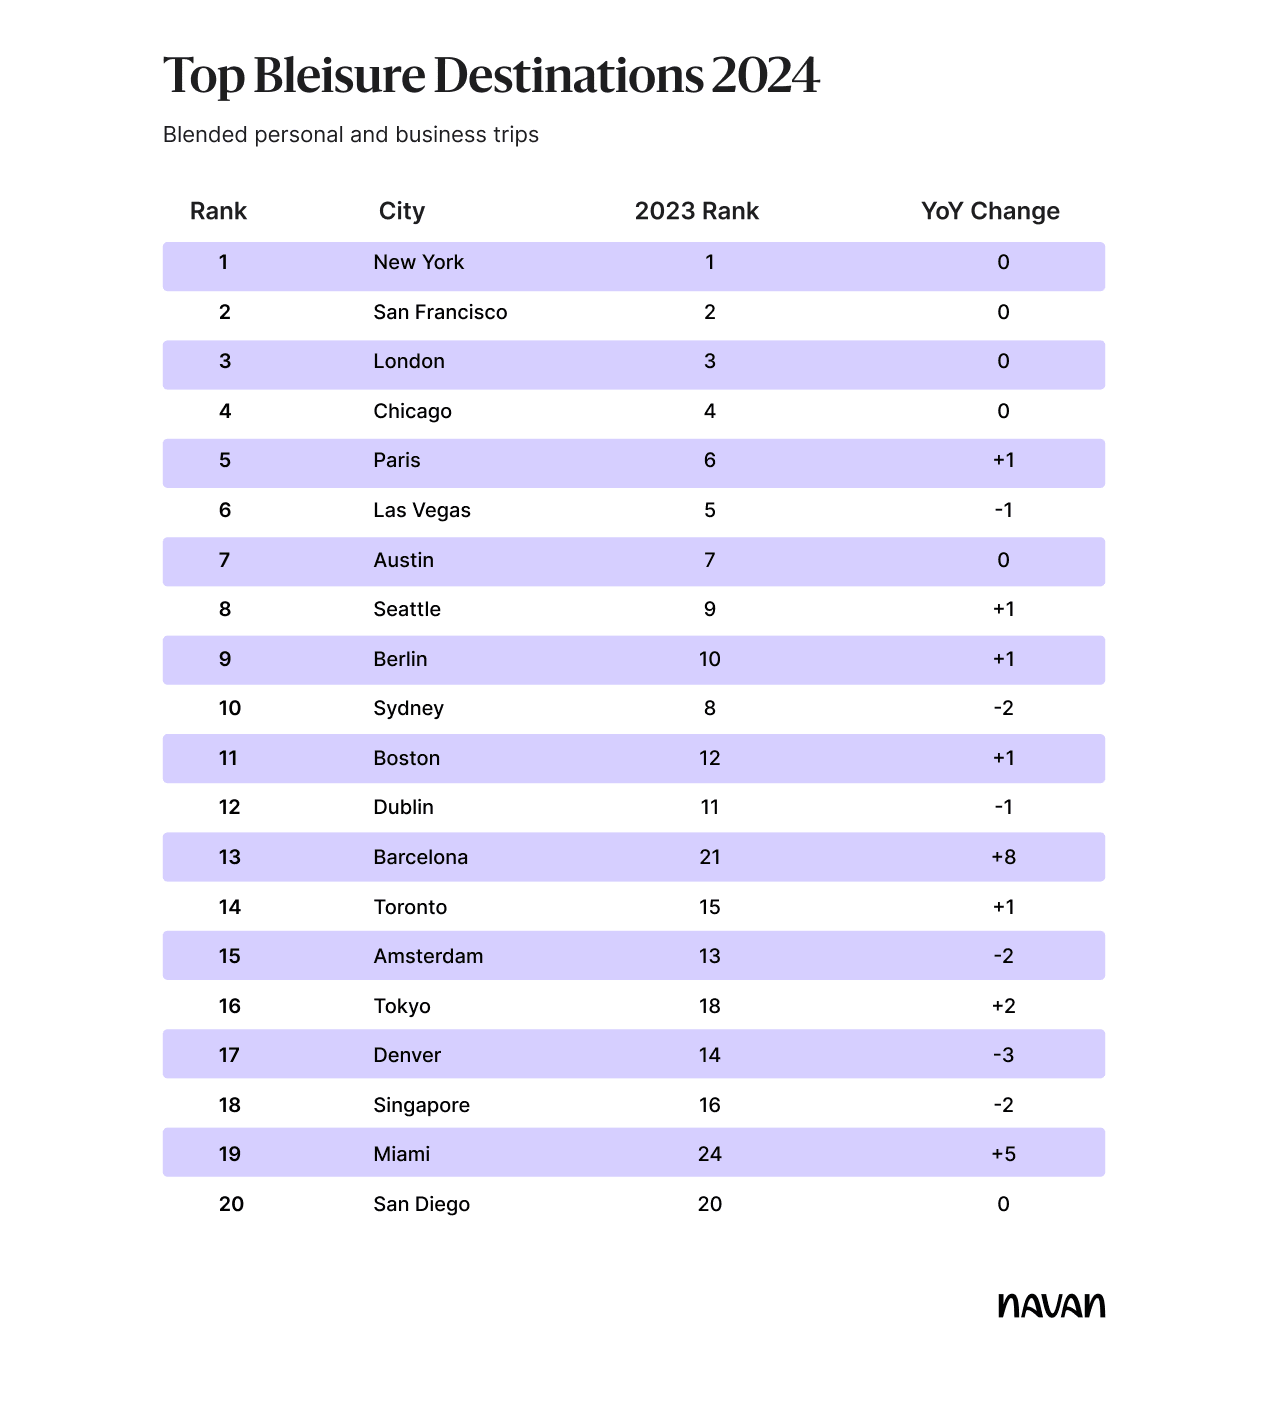
Where are bleisure travelers spending their downtime? Unsurprisingly, the top picks are business hot spots. After all, with flight costs covered by the company, why not take some extra time to explore the immediate vicinity?
Four cities — New York, San Francisco, London, and Chicago — all held their ground at the top of the list. The big mover in 2024 was Barcelona, which jumped a full eight spots to burst into the top 15.
Miami also showed up on more itineraries, jumping five spots to No. 19. Sydney, Amsterdam, Denver, and Singapore all dropped at least two spots, but remain solidly in the top 20.
Upleveling Travel and Spend Management
For some employees, returning from their well-earned trip extensions means having to submit expense reports for business-related purchases. That’s not only a time-consuming annoyance, but it’s also more difficult to do accurately for blended trips.
For example, a personal expense receipt might accidentally get mixed in with business purchases. It happens. Asset misappropriation makes up 86% of all occupational fraud cases — and 15% of these are related to expense reimbursements. The median loss for expense reimbursement fraud is $33,000, and it takes about two years to discover the discrepancy.
Of course, that shouldn’t prevent companies from encouraging employees to unplug. But avoiding problems starts with using the right tools — like a T&E management platform with a personal travel option that offers access to corporate travel benefits (such as lower prices) and clear boundaries for personal trip expenses. And, since managers can set policies that create guardrails around business expenses, they don’t have to worry about business travelers overspending, or having personal expenses end up as business costs.
With Navan, companies can see a reduction in fraud and mistakes. Road warriors can enjoy more convenient bleisure trips. And everyone can experience the magic of no expense reports.
And that’s only some of what Navan can do. To see more, schedule a demo or get up and running with Navan in just 5 minutes.
Methodology:
Navan analyzed global travel booking data from 2019–2024 and isolated booking patterns for a cohort of customers that have used the Navan platform since 2019 through August 31, 2024. Navan also analyzed personal travel bookings made from 2023–2024.
This content is for informational purposes only. It doesn't necessarily reflect the views of Navan and should not be construed as legal, tax, benefits, financial, accounting, or other advice. If you need specific advice for your business, please consult with an expert, as rules and regulations change regularly.